Under Armour 2011 Annual Report Download - page 47
Download and view the complete annual report
Please find page 47 of the 2011 Under Armour annual report below. You can navigate through the pages in the report by either clicking on the pages listed below, or by using the keyword search tool below to find specific information within the annual report.-
 1
1 -
2
-
3
-
4
-
5
-
6
-
7
-
8
-
9
-
10
-
11
-
12
-
13
-
14
-
15
-
16
-
17
-
18
-
19
-
20
-
21
-
22
-
23
-
24
-
25
-
26
-
27
-
28
-
29
-
30
-
31
-
32
-
33
-
34
-
35
-
36
-
 37
37 -
 38
38 -
 39
39 -
 40
40 -
 41
41 -
 42
42 -
 43
43 -
 44
44 -
 45
45 -
 46
46 -
 47
47 -
 48
48 -
 49
49 -
 50
50 -
 51
51 -
 52
52 -
 53
53 -
 54
54 -
 55
55 -
 56
56 -
 57
57 -
58
-
59
-
60
-
61
-
62
-
63
-
64
-
65
-
66
-
67
-
68
-
69
-
70
-
71
-
72
-
73
-
74
-
75
-
76
-
77
-
78
-
79
-
80
-
81
-
82
-
83
-
84
-
85
-
86
-
87
-
88
-
89
-
90
-
91
-
92
-
93
-
94
-
95
-
96
 |
 |
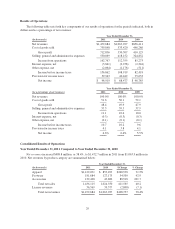
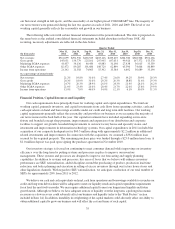
bags and CHARGED COTTON®, and continued increases in our made-for strategy across our factory
house store base. In 2009, operational initiatives were put in place to improve our inventory
management which assisted in the decrease of inventory for that period; and
• an increase in accounts receivable during 2010 primarily due to a 36.9% increase in net sales during the
fourth quarter of 2010; partially offset by
• higher income taxes payable in 2010 as compared to 2009.
Adjustments to net income for non-cash items increased in 2010 as compared to 2009 primarily due to
unrealized foreign currency exchange rate losses in 2010 as compared to unrealized foreign currency exchange
rate gains in 2009.
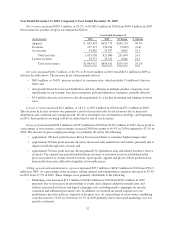
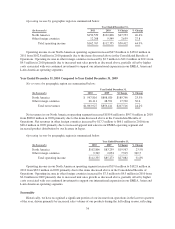
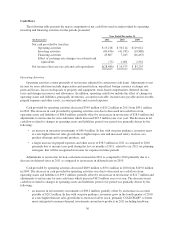
Investing Activities
Cash used in investing activities increased $47.6 million to $89.4 million in 2011 from $41.8 million in
2010. This increase in cash used in investing activities was primarily due to the acquisition of our corporate
headquarters and increased investments in our direct to consumer sales channel, in-store fixture program and
corporate and distribution facilities. In addition, in connection with the assumed loan for the acquisition of our
corporate headquarters, we were required to set aside $5.0 million in restricted cash. Refer to Note 7 of the
consolidated financial statements for a discussion of restricted cash.
Cash used in investing activities increased $21.9 million to $41.8 million in 2010 from $19.9 million in
2009. This increase in cash used in investing activities was primarily due to increased investments in new factory
house stores and corporate and distribution facilities, partially offset by lower investments in our in-store fixture
program and branded concept shops. In addition, cash used in investing activities increased due to a deposit made
in late December 2010 for a minority investment completed in early 2011 in Dome Corporation, our Japanese
licensee.
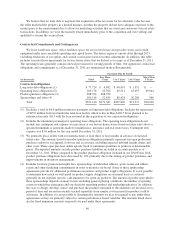
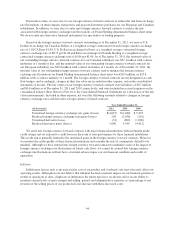
Total capital expenditures were $115.4 million, $33.1 million and $24.6 million in 2011, 2010 and 2009,
respectively, which includes the acquisition of our corporate headquarters and other related expenditures in 2011.
Total capital expenditures in 2011, 2010 and 2009 included non-cash transactions of $36.0 million, $2.9 million
and $4.8 million, respectively. Because we receive certain capital expenditures prior to transmitting payment for
these capital investments, total capital expenditures exceed capital investments included in our consolidated
statements of cash flows. Capital expenditures for 2012 are expected to be in the range of $60 million to $65
million.
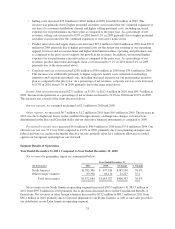
Financing Activities
Cash provided by financing activities increased $38.6 million to $45.8 million in 2011 from $7.2 million in
2010. This increase was primarily due to the term loan borrowed under the credit facility to partially fund the
purchase of our corporate headquarters, as well as excess tax benefits and proceeds from stock-based
compensation arrangements.
Cash provided by financing activities increased $23.7 million to $7.2 million in 2010 from cash used in
financing activities of $16.5 million in 2009. This increase was primarily due to the final payment made on our
prior revolving credit facility that was terminated during 2009.
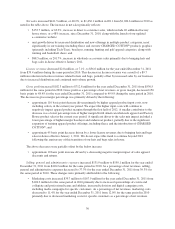
Credit Facility
In March 2011, we entered into a new $325.0 million credit facility with certain lending institutions and
terminated our prior $200.0 million revolving credit facility in order to increase our available financing and to
expand our lending syndicate. The credit facility has a term of four years and provides for a committed revolving
37