Under Armour 2011 Annual Report Download - page 40
Download and view the complete annual report
Please find page 40 of the 2011 Under Armour annual report below. You can navigate through the pages in the report by either clicking on the pages listed below, or by using the keyword search tool below to find specific information within the annual report.-
 1
1 -
2
-
3
-
4
-
5
-
6
-
7
-
8
-
9
-
10
-
11
-
12
-
13
-
14
-
15
-
16
-
17
-
18
-
19
-
20
-
21
-
22
-
23
-
24
-
25
-
26
-
27
-
28
-
29
-
 30
30 -
 31
31 -
 32
32 -
 33
33 -
 34
34 -
 35
35 -
 36
36 -
 37
37 -
 38
38 -
 39
39 -
 40
40 -
 41
41 -
 42
42 -
 43
43 -
 44
44 -
 45
45 -
 46
46 -
 47
47 -
 48
48 -
 49
49 -
 50
50 -
51
-
52
-
53
-
54
-
55
-
56
-
57
-
58
-
59
-
60
-
61
-
62
-
63
-
64
-
65
-
66
-
67
-
68
-
69
-
70
-
71
-
72
-
73
-
74
-
75
-
76
-
77
-
78
-
79
-
80
-
81
-
82
-
83
-
84
-
85
-
86
-
87
-
88
-
89
-
90
-
91
-
92
-
93
-
94
-
95
-
96
 |
 |
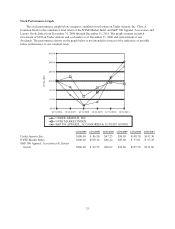
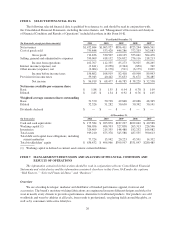
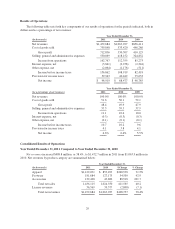
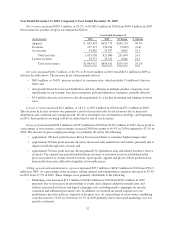
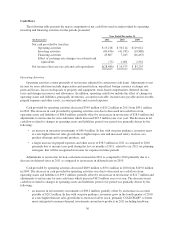
Net sales increased $411.5 million, or 40.2%, to $1,436.1 million in 2011 from $1,024.6 million in 2010 as
noted in the table above. The increase in net sales primarily reflects:
• $152.7 million, or 62.2%, increase in direct to consumer sales, which include 26 additional factory
house stores, or a 48% increase, since December 31, 2010, along with the launch of our updated
e-commerce website;
• unit growth driven by increased distribution and new offerings in multiple product categories, most
significantly in our training (including fleece and our new CHARGED COTTON®product), graphics
(primarily including Tech-Tees), baselayer, running, hunting and golf apparel categories, along with
running and basketball shoes; and
• $88.5 million, or 201.7%, increase in wholesale accessories sales primarily due to bringing hats and
bags sales in-house effective January 2011.
License revenues decreased $2.8 million, or 7.1%, to $36.6 million for the year ended December 31, 2011
from $39.4 million during the same period in 2010. This decrease in license revenues was a result of a $9.7
million reduction in license revenues related to hats and bags, partially offset by increased sales by our licensees
due to increased distribution and continued unit volume growth.
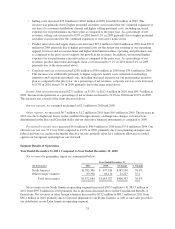
Gross profit increased $182.3 million to $712.8 million for the year ended December 31, 2011 from $530.5
million for the same period in 2010. Gross profit as a percentage of net revenues, or gross margin, decreased 150
basis points to 48.4% for the year ended December 31, 2011 compared to 49.9% during the same period in 2010.
The decrease in gross margin percentage was primarily driven by the following:
• approximate 110 basis point decrease driven primarily by higher apparel product input costs, now
including cotton, in the current year period. We expect the higher input costs will continue to
negatively impact apparel product margins through the first half of 2012. A smaller contributor to the
decrease was a lower percentage mix of higher margin North American wholesale apparel and Factory
House product sales in the current year period. A significant driver to the sales mix impact included a
lower percentage of higher margin baselayer and underwear product, partially due to the significant
expansion of training apparel product offerings, including fleece and the introduction of CHARGED
COTTON®; and
• approximate 45 basis point decrease driven by a lower license revenues due to bringing hats and bags
sales in-house effective January 1, 2011. We do not expect this trend to continue beyond 2011
following the anniversary of this transition of our hats and bags sales in-house.
The above decreases were partially offset by the below increase:
• approximate 10 basis point increase driven by a decreasing negative margin impact of sales apparel
discounts and returns.
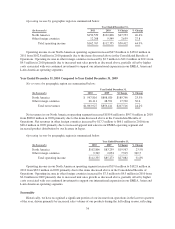
Selling, general and administrative expenses increased $131.9 million to $550.1 million for the year ended
December 31, 2011 from $418.2 million for the same period in 2010. As a percentage of net revenues, selling,
general and administrative expenses decreased to 37.3% for the year ended December 31, 2011 from 39.3% for
the same period in 2010. These changes were primarily attributable to the following:
• Marketing costs increased $39.7 million to $167.9 million for the year ended December 31, 2011 from
$128.2 million for the same period in 2010 primarily due to increased sponsorships of events and
collegiate and professional teams and athletes, increased television and digital campaign costs,
including media campaigns for specific customers. As a percentage of net revenues, marketing costs
decreased to 11.4% for the year ended December 31, 2011 from 12.0% for the same period in 2010
primarily due to decreased marketing costs for specific customers as a percentage of net revenues.
30