Under Armour 2011 Annual Report Download - page 81
Download and view the complete annual report
Please find page 81 of the 2011 Under Armour annual report below. You can navigate through the pages in the report by either clicking on the pages listed below, or by using the keyword search tool below to find specific information within the annual report.-
 1
1 -
2
-
3
-
4
-
5
-
6
-
7
-
8
-
9
-
10
-
11
-
12
-
13
-
14
-
15
-
16
-
17
-
18
-
19
-
20
-
21
-
22
-
23
-
24
-
25
-
26
-
27
-
28
-
29
-
30
-
31
-
32
-
33
-
34
-
35
-
36
-
37
-
38
-
39
-
40
-
41
-
42
-
43
-
44
-
45
-
46
-
47
-
48
-
49
-
50
-
51
-
52
-
53
-
54
-
55
-
56
-
57
-
58
-
59
-
60
-
61
-
62
-
63
-
64
-
65
-
66
-
67
-
68
-
69
-
70
-
 71
71 -
 72
72 -
 73
73 -
 74
74 -
 75
75 -
 76
76 -
 77
77 -
 78
78 -
 79
79 -
 80
80 -
 81
81 -
 82
82 -
 83
83 -
 84
84 -
 85
85 -
 86
86 -
 87
87 -
 88
88 -
 89
89 -
 90
90 -
 91
91 -
92
-
93
-
94
-
95
-
96
 |
 |

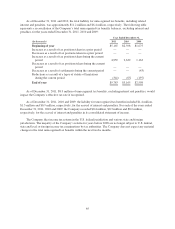
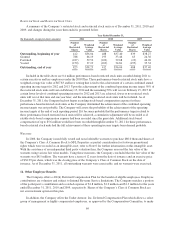
The Company has an operating lease agreement with an entity controlled by the Company’s CEO to lease an
aircraft for business purposes. The Company paid $0.7 million, $1.0 million and $0.6 million in usage fees to this
entity for its use of the aircraft during the years ended December 31, 2011, 2010 and 2009, respectively. No
amounts were payable to this related party as of December 31, 2011 and 2010. The Company determined the
usage fees charged are at or below market.
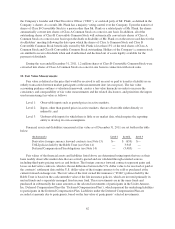
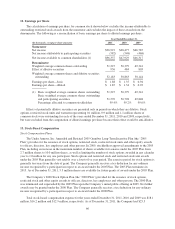
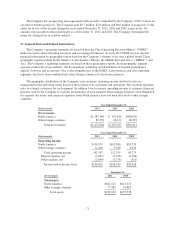
17. Segment Data and Related Information
The Company’s operating segments are based on how the Chief Operating Decision Maker (“CODM”)
makes decisions about allocating resources and assessing performance. As such, the CODM receives discrete
financial information by geographic region based on the Company’s strategy to become a global brand. These
geographic regions include North America; Latin America; Europe, the Middle East and Africa (“EMEA”); and
Asia. The Company’s operating segments are based on these geographic regions. Each geographic segment
operates exclusively in one industry: the development, marketing and distribution of branded performance
apparel, footwear and accessories. Due to the insignificance of the EMEA, Latin America and Asia operating
segments, they have been combined into other foreign countries for disclosure purposes.
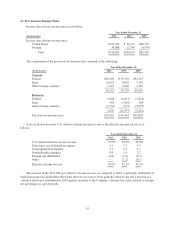
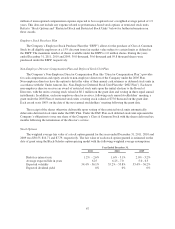
The geographic distribution of the Company’s net revenues, operating income and total assets are
summarized in the following tables based on the location of its customers and operations. Net revenues represent
sales to external customers for each segment. In addition to net revenues, operating income is a primary financial
measure used by the Company to evaluate performance of each segment. Intercompany balances were eliminated
for separate disclosure and corporate expenses from North America have not been allocated to other foreign
countries.
(In thousands)
Year Ended December 31,
2011 2010 2009
Net revenues
North America $1,383,346 $ 997,816 $808,020
Other foreign countries 89,338 66,111 48,391
Total net revenues $1,472,684 $1,063,927 $856,411
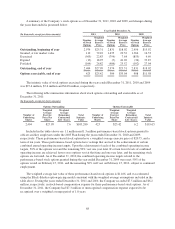
(In thousands)
Year Ended December 31,
2011 2010 2009
Operating income
North America $150,559 $102,806 $83,239
Other foreign countries 12,208 9,549 2,034
Total operating income 162,767 112,355 85,273
Interest expense, net (3,841) (2,258) (2,344)
Other expense, net (2,064) (1,178) (511)
Income before income taxes $156,862 $108,919 $82,418
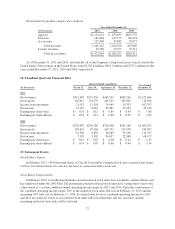
(In thousands)
December 31,
2011 2010
Total assets
North America $842,121 $613,515
Other foreign countries 77,089 61,863
Total assets $919,210 $675,378
71