Ubisoft 2014 Annual Report Download - page 15
Download and view the complete annual report
Please find page 15 of the 2014 Ubisoft annual report below. You can navigate through the pages in the report by either clicking on the pages listed below, or by using the keyword search tool below to find specific information within the annual report.-
 1
1 -
2
-
3
-
4
-
 5
5 -
 6
6 -
 7
7 -
 8
8 -
 9
9 -
 10
10 -
 11
11 -
 12
12 -
 13
13 -
 14
14 -
 15
15 -
 16
16 -
 17
17 -
 18
18 -
 19
19 -
 20
20 -
 21
21 -
 22
22 -
 23
23 -
 24
24 -
 25
25 -
26
-
27
-
28
-
29
-
30
-
31
-
32
-
33
-
34
-
35
-
36
-
37
-
38
-
39
-
40
-
41
-
42
-
43
-
44
-
45
-
46
-
47
-
48
-
49
-
50
-
51
-
52
-
53
-
54
-
55
-
56
-
57
-
58
-
59
-
60
-
61
-
62
-
63
-
64
-
65
-
66
-
67
-
68
-
69
-
70
-
71
-
72
-
73
-
74
-
75
-
76
-
77
-
78
-
79
-
80
-
81
-
82
-
83
-
84
-
85
-
86
-
87
-
88
-
89
-
90
-
91
-
92
-
93
-
94
-
95
-
96
-
97
-
98
-
99
-
100
-
101
-
102
-
103
-
104
-
105
-
106
-
107
-
108
-
109
-
110
-
111
-
112
-
113
-
114
-
115
-
116
-
117
-
118
-
119
-
120
-
121
-
122
-
123
-
124
-
125
-
126
-
127
-
128
-
129
-
130
-
131
-
132
-
133
-
134
-
135
-
136
-
137
-
138
-
139
-
140
-
141
-
142
-
143
-
144
-
145
-
146
-
147
-
148
-
149
-
150
-
151
-
152
-
153
-
154
-
155
-
156
-
157
-
158
-
159
-
160
-
161
-
162
-
163
-
164
-
165
-
166
-
167
-
168
-
169
-
170
-
171
-
172
-
173
-
174
-
175
-
176
-
177
-
178
-
179
-
180
-
181
-
182
-
183
-
184
-
185
-
186
-
187
-
188
-
189
-
190
-
191
-
192
-
193
-
194
-
195
-
196
-
197
-
198
-
199
-
200
-
201
-
202
-
203
-
204
-
205
-
206
-
207
-
208
-
209
-
210
-
211
-
212
-
213
-
214
-
215
-
216
-
217
-
218
-
219
-
220
-
221
-
222
-
223
-
224
-
225
-
226
-
227
-
228
-
229
-
230
-
231
-
232
-
233
-
234
-
235
-
236
-
237
-
238
-
239
-
240
-
241
-
242
-
243
 |
 |

Management Report
2014
10
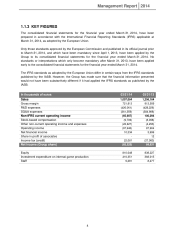
1.3 CASH AND CAPITAL
1.3.1 CHANGES IN EQUITY
The video game business line calls for capital expenditure on development of around 35% of sales.
This capital expenditure takes place over on average periods of between 24 and 36 months, which
publishers must be able to finance out of their own resources. Furthermore, publishers are required to
launch new releases on a regular basis, and their level of success cannot be guaranteed.
For these reasons, significant capitalization is essential to guarantee the continuous financing of
capital expenditure and to deal with contingencies stemming from the success or failure of a particular
title without endangering the future of the Company.
With equity of €810 million, Ubisoft easily finances its capital investments in games, which amount to
€411 million.
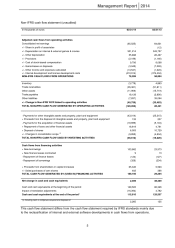
1.3.2 CASH FLOW
Video game publishers have two kinds of cash flows:
- Cash flows for financing development costs are spread evenly over a period of 24 to 36
months, given that each project progressively scales up but that teams work on a number
of projects. They represented €480 million in 2013/2014.
- Cash flows linked to the marketing of games, which are highly seasonal in nature
(25% of sales is made in the first half of the year and 75% in the second half).
These cash flows include a lag between production costs and cash inflows. This is
because the Company must first finance product manufacturing, which accounts for 28%
of sales and is payable at 30 days on average, and also finance marketing costs (around
18% of sales) before cash flows in at an average of 48 days after the games hit the
shelves. For this reason, the Company must finance significant cash peaks around
Christmas time before seeing its cash climb back up during February and March. This
timing may be different if Q4 of the financial year is very strong, because in this case
working capital requirements may be higher, as was the case in the 2013/2014 financial
year with the launch of the game “South Park: The Stick of Truth” in March. It should also
be noted that the development of digital activity, which is expected to grow from 19% of
sales in 2013/2014 to approximately 25% in 2014/2015, should relieve financing
requirements associated with the physical production of marketed products.
Accordingly, in the financial year 2013/2014, the Company’s net cash varied between €105 million and
€(13) million, with debt peaking from October to December.