Ubisoft 2014 Annual Report Download - page 12
Download and view the complete annual report
Please find page 12 of the 2014 Ubisoft annual report below. You can navigate through the pages in the report by either clicking on the pages listed below, or by using the keyword search tool below to find specific information within the annual report.-
 1
1 -
 2
2 -
 3
3 -
 4
4 -
 5
5 -
 6
6 -
 7
7 -
 8
8 -
 9
9 -
 10
10 -
 11
11 -
 12
12 -
 13
13 -
 14
14 -
 15
15 -
 16
16 -
 17
17 -
 18
18 -
 19
19 -
 20
20 -
 21
21 -
 22
22 -
23
-
24
-
25
-
26
-
27
-
28
-
29
-
30
-
31
-
32
-
33
-
34
-
35
-
36
-
37
-
38
-
39
-
40
-
41
-
42
-
43
-
44
-
45
-
46
-
47
-
48
-
49
-
50
-
51
-
52
-
53
-
54
-
55
-
56
-
57
-
58
-
59
-
60
-
61
-
62
-
63
-
64
-
65
-
66
-
67
-
68
-
69
-
70
-
71
-
72
-
73
-
74
-
75
-
76
-
77
-
78
-
79
-
80
-
81
-
82
-
83
-
84
-
85
-
86
-
87
-
88
-
89
-
90
-
91
-
92
-
93
-
94
-
95
-
96
-
97
-
98
-
99
-
100
-
101
-
102
-
103
-
104
-
105
-
106
-
107
-
108
-
109
-
110
-
111
-
112
-
113
-
114
-
115
-
116
-
117
-
118
-
119
-
120
-
121
-
122
-
123
-
124
-
125
-
126
-
127
-
128
-
129
-
130
-
131
-
132
-
133
-
134
-
135
-
136
-
137
-
138
-
139
-
140
-
141
-
142
-
143
-
144
-
145
-
146
-
147
-
148
-
149
-
150
-
151
-
152
-
153
-
154
-
155
-
156
-
157
-
158
-
159
-
160
-
161
-
162
-
163
-
164
-
165
-
166
-
167
-
168
-
169
-
170
-
171
-
172
-
173
-
174
-
175
-
176
-
177
-
178
-
179
-
180
-
181
-
182
-
183
-
184
-
185
-
186
-
187
-
188
-
189
-
190
-
191
-
192
-
193
-
194
-
195
-
196
-
197
-
198
-
199
-
200
-
201
-
202
-
203
-
204
-
205
-
206
-
207
-
208
-
209
-
210
-
211
-
212
-
213
-
214
-
215
-
216
-
217
-
218
-
219
-
220
-
221
-
222
-
223
-
224
-
225
-
226
-
227
-
228
-
229
-
230
-
231
-
232
-
233
-
234
-
235
-
236
-
237
-
238
-
239
-
240
-
241
-
242
-
243
 |
 |

Management Report
2014
7
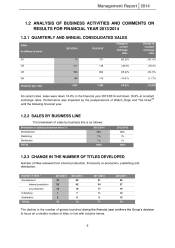
1.2.4 SALES BY PLATFORM
2013/2014
2012/2013
Nintendo 3 DS™
0%
1%
PC
15%
11%
PlayStation
®
3
25%
30%
PlayStation
®
4
9%
-
PS VITA
1%
2%
XBOX 360™
27%
34%
XBOX One™
6%
-
Wii™
11%
16%
Wii U™
3%
4%
Other
3%
2%
TOTAL
100%
100%
Launched in November 2013, the PS4 and Xbox One already represent 15% of total sales.
1.2.5 SALES BY GEOGRAPHIC REGION
The breakdown of Group sales by geographic region is as follows:
Financial year
2013/2014
%
2012/2013
%
In millions of euros
France
79
8%
120
10%
Germany
70
7%
79
6%
United Kingdom
109
11%
121
10%
Rest of Europe
145
14%
179
14%
Total Europe
403
40%
499
40%
United States/Canada
508
50%
664
53%
Asia/Pacific
54
6%
82
7%
Rest of world
42
4%
10
1%
TOTAL
1,007
100%
1,061
100%
The share of each of the geographic regions remained more or less stable over the year.