Ubisoft 2014 Annual Report Download - page 13
Download and view the complete annual report
Please find page 13 of the 2014 Ubisoft annual report below. You can navigate through the pages in the report by either clicking on the pages listed below, or by using the keyword search tool below to find specific information within the annual report.-
 1
1 -
2
-
 3
3 -
 4
4 -
 5
5 -
 6
6 -
 7
7 -
 8
8 -
 9
9 -
 10
10 -
 11
11 -
 12
12 -
 13
13 -
 14
14 -
 15
15 -
 16
16 -
 17
17 -
 18
18 -
 19
19 -
 20
20 -
 21
21 -
 22
22 -
 23
23 -
24
-
25
-
26
-
27
-
28
-
29
-
30
-
31
-
32
-
33
-
34
-
35
-
36
-
37
-
38
-
39
-
40
-
41
-
42
-
43
-
44
-
45
-
46
-
47
-
48
-
49
-
50
-
51
-
52
-
53
-
54
-
55
-
56
-
57
-
58
-
59
-
60
-
61
-
62
-
63
-
64
-
65
-
66
-
67
-
68
-
69
-
70
-
71
-
72
-
73
-
74
-
75
-
76
-
77
-
78
-
79
-
80
-
81
-
82
-
83
-
84
-
85
-
86
-
87
-
88
-
89
-
90
-
91
-
92
-
93
-
94
-
95
-
96
-
97
-
98
-
99
-
100
-
101
-
102
-
103
-
104
-
105
-
106
-
107
-
108
-
109
-
110
-
111
-
112
-
113
-
114
-
115
-
116
-
117
-
118
-
119
-
120
-
121
-
122
-
123
-
124
-
125
-
126
-
127
-
128
-
129
-
130
-
131
-
132
-
133
-
134
-
135
-
136
-
137
-
138
-
139
-
140
-
141
-
142
-
143
-
144
-
145
-
146
-
147
-
148
-
149
-
150
-
151
-
152
-
153
-
154
-
155
-
156
-
157
-
158
-
159
-
160
-
161
-
162
-
163
-
164
-
165
-
166
-
167
-
168
-
169
-
170
-
171
-
172
-
173
-
174
-
175
-
176
-
177
-
178
-
179
-
180
-
181
-
182
-
183
-
184
-
185
-
186
-
187
-
188
-
189
-
190
-
191
-
192
-
193
-
194
-
195
-
196
-
197
-
198
-
199
-
200
-
201
-
202
-
203
-
204
-
205
-
206
-
207
-
208
-
209
-
210
-
211
-
212
-
213
-
214
-
215
-
216
-
217
-
218
-
219
-
220
-
221
-
222
-
223
-
224
-
225
-
226
-
227
-
228
-
229
-
230
-
231
-
232
-
233
-
234
-
235
-
236
-
237
-
238
-
239
-
240
-
241
-
242
-
243
 |
 |

Management Report
2014
8
1.2.6 CHANGES IN THE INCOME STATEMENT
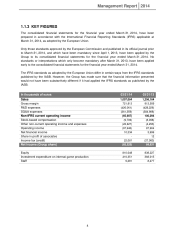
The gross profit margin remained at a high level as a percentage of sales at 71.7% (€721.8 million),
which represents a slight drop compared with the gross profit margin of 72.7% (€913.5 million) in
2012/2013. This drop is due to a decline in the core gamers segment. This was mostly offset, as a
percentage of sales, by the growth in digital distribution.
The non-IFRS operating loss of €(65.6) million is in line with the target communicated when sales
figures for the third quarter of 2013/2014 were published.
The change in the non-IFRS operating result breaks down as follows:
Decline of €191.7 million in gross profit
Decline of €2.1 million in R&D costs to €426.1 million (42.3% of sales), compared with
€428.2 million (34.1%) in 2012/2013.
Decline of €23.6 million in SG&A expenses to €361.3 million (35.9%), compared with
€385.0 million (30.6%) in 2012/2013:
− Variable marketing expenses totaled 20.2% of sales (€204.4 million), compared with
18.2% (€228.7 million) in 2012/2013.
− Structure costs totaled 15.6% of sales (€157.0 million), compared with 12.4%
(€156.3 million).
The non-IFRS net loss totaled €(49.3) million, corresponding to a non-IFRS net loss per share (diluted)
of €(0.46), compared with a non-IFRS net profit of €69.2 million in 2012/2013 or €0.71 per share.
The IFRS net loss totaled €(65.5) million, corresponding to an IFRS net loss per share (diluted) of
€(0.61), compared with an IFRS net profit of €64.8 million in 2012/2013 or €0.67 per share.
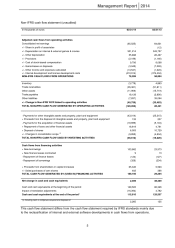
1.2.7 CHANGE IN THE WORKING CAPITAL REQUIREMENT (WCR) AND
DEBT LEVELS
The working capital requirement increased by €41 million compared with €30 million in the previous
year. The main changes related to:
- Assets side: increase in trade receivables (€35 million), inventory (€4 million) and other
assets (€12 million)
- Liabilities side: increase in trade payables (€18 million) and decrease in other liabilities
(€(8) million).
The increase in trade receivables and trade payables is mainly due to the launch of the game South
Park
TM
the Stick of Truth
TM
in March. The increase in other assets is attributable in part to the
capitalization of tax credits linked to the financial losses.