U-Haul 2004 Annual Report Download - page 98
Download and view the complete annual report
Please find page 98 of the 2004 U-Haul annual report below. You can navigate through the pages in the report by either clicking on the pages listed below, or by using the keyword search tool below to find specific information within the annual report.-
 1
1 -
2
-
3
-
4
-
5
-
6
-
7
-
8
-
9
-
10
-
11
-
12
-
13
-
14
-
15
-
16
-
17
-
18
-
19
-
20
-
21
-
22
-
23
-
24
-
25
-
26
-
27
-
28
-
29
-
30
-
31
-
32
-
33
-
34
-
35
-
36
-
37
-
38
-
39
-
40
-
41
-
42
-
43
-
44
-
45
-
46
-
47
-
48
-
49
-
50
-
51
-
52
-
53
-
54
-
55
-
56
-
57
-
58
-
59
-
60
-
61
-
62
-
63
-
64
-
65
-
66
-
67
-
68
-
69
-
70
-
71
-
72
-
73
-
74
-
75
-
76
-
77
-
78
-
79
-
80
-
81
-
82
-
83
-
84
-
85
-
86
-
87
-
 88
88 -
 89
89 -
 90
90 -
 91
91 -
 92
92 -
 93
93 -
 94
94 -
 95
95 -
 96
96 -
 97
97 -
 98
98 -
 99
99 -
 100
100 -
 101
101 -
 102
102 -
 103
103 -
 104
104 -
 105
105 -
 106
106 -
 107
107 -
 108
108 -
109
-
110
-
111
-
112
-
113
-
114
-
115
-
116
-
117
-
118
-
119
-
120
-
121
-
122
-
123
-
124
-
125
 |
 |

AMERCO AND CONSOLIDATED ENTITIES
NOTES TO CONSOLIDATED FINANCIAL STATEMENTS Ì (Continued)
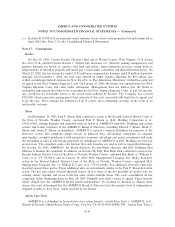
On May 20, 2003, RepWest consented to an Order for Supervision issued by the Arizona Department of
Insurance (""DOI''). The DOI determined that RepWest's level of risk based capital (""RBC'') allowed for
regulatory control. Pursuant to this order and Arizona law, during the period of supervision, RepWest may not
engage in certain activities without the prior approval of the DOI.
If RepWest fails to satisfy the requirements to abate the DOI's concerns, the DOI may take further
action, including, but not limited to, commencing a conservatorship.
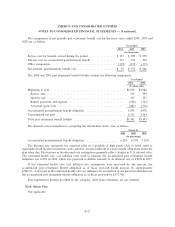
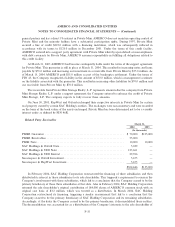
Audited statutory net income (loss) for Oxford for the years ended December 31, 2003, 2002 and 2001
was $3.3 million, $(11.6 million) and $(1.3 million), respectively; audited statutory capital and surplus was
$64.0 million and $39.1 million at December 31, 2003 and 2002, respectively. Audited statutory net income for
CFLIC for the years ended December 31, 2003, 2002 and 2001 was $4.1 million, $3.2 million and
$3.6 million, respectively; audited statutory capital and surplus was $22.5 million and $17.2 million at
December 31, 2003 and 2002, respectively. Audited statutory net income (loss) for NAI for the years ended
December 31, 2003, 2002 and 2001 was $3.1 million, $3.1 million and $(0.7) million, respectively; audited
statutory capital and surplus was $12.5 million and $9.5 million at December 31, 2003 and 2002, respectively.
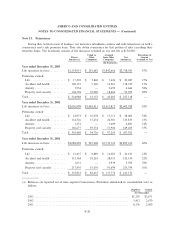
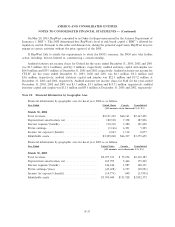
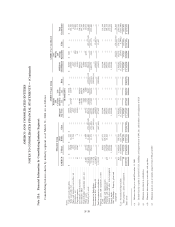
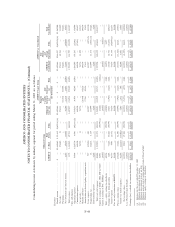
Note 21: Financial Information by Geographic Area
Financial information by geographic area for Ñscal year 2004 is as follows:
Year Ended United States Canada Consolidated
(All amounts are in thousands U.S. $'s)
March 31, 2004
Total revenues ÏÏÏÏÏÏÏÏÏÏÏÏÏÏÏÏÏÏÏÏÏÏÏÏÏÏÏÏÏÏÏÏÏÏÏÏÏ $2,101,332 $66,163 $2,167,495
Depreciation/amortization, net ÏÏÏÏÏÏÏÏÏÏÏÏÏÏÏÏÏÏÏÏÏÏÏÏ 180,538 7,358 187,896
Interest expense/(beneÑt) ÏÏÏÏÏÏÏÏÏÏÏÏÏÏÏÏÏÏÏÏÏÏÏÏÏÏÏ 118,310 3,380 121,690
Pretax earnings ÏÏÏÏÏÏÏÏÏÏÏÏÏÏÏÏÏÏÏÏÏÏÏÏÏÏÏÏÏÏÏÏÏÏÏÏÏ (1,166) 6,391 5,225
Income tax expense/(beneÑt) ÏÏÏÏÏÏÏÏÏÏÏÏÏÏÏÏÏÏÏÏÏÏÏÏ 6,963 1,114 8,077
IdentiÑable assets ÏÏÏÏÏÏÏÏÏÏÏÏÏÏÏÏÏÏÏÏÏÏÏÏÏÏÏÏÏÏÏÏÏÏÏ $3,309,268 $66,337 $3,375,605
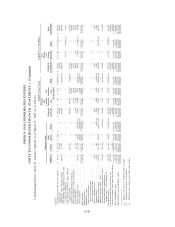
Financial information by geographic area for Ñscal year 2003 is as follows:
Year Ended United States Canada Consolidated
(All amounts are in thousands U.S. $'s)
March 31, 2003
Total revenues ÏÏÏÏÏÏÏÏÏÏÏÏÏÏÏÏÏÏÏÏÏÏÏÏÏÏÏÏÏÏÏÏÏÏÏÏ $2,077,333 $ 55,054 $2,132,387
Depreciation/amortization, net ÏÏÏÏÏÏÏÏÏÏÏÏÏÏÏÏÏÏÏÏÏÏÏ 169,799 5,466 175,265
Interest expense/(beneÑt) ÏÏÏÏÏÏÏÏÏÏÏÏÏÏÏÏÏÏÏÏÏÏÏÏÏÏ 146,144 1,987 148,131
Pretax earnings/(loss)ÏÏÏÏÏÏÏÏÏÏÏÏÏÏÏÏÏÏÏÏÏÏÏÏÏÏÏÏÏÏ (45,628) 6,707 (38,921)
Income tax expense/(beneÑt) ÏÏÏÏÏÏÏÏÏÏÏÏÏÏÏÏÏÏÏÏÏÏÏ (14,775) 840 (13,935)
IdentiÑable assets ÏÏÏÏÏÏÏÏÏÏÏÏÏÏÏÏÏÏÏÏÏÏÏÏÏÏÏÏÏÏÏÏÏÏ $3,700,444 $131,928 $3,832,372
F-37