U-Haul 2004 Annual Report Download - page 24
Download and view the complete annual report
Please find page 24 of the 2004 U-Haul annual report below. You can navigate through the pages in the report by either clicking on the pages listed below, or by using the keyword search tool below to find specific information within the annual report.-
 1
1 -
2
-
3
-
4
-
5
-
6
-
7
-
8
-
9
-
10
-
11
-
12
-
13
-
 14
14 -
 15
15 -
 16
16 -
 17
17 -
 18
18 -
 19
19 -
 20
20 -
 21
21 -
 22
22 -
 23
23 -
 24
24 -
 25
25 -
 26
26 -
 27
27 -
 28
28 -
 29
29 -
 30
30 -
 31
31 -
 32
32 -
 33
33 -
 34
34 -
35
-
36
-
37
-
38
-
39
-
40
-
41
-
42
-
43
-
44
-
45
-
46
-
47
-
48
-
49
-
50
-
51
-
52
-
53
-
54
-
55
-
56
-
57
-
58
-
59
-
60
-
61
-
62
-
63
-
64
-
65
-
66
-
67
-
68
-
69
-
70
-
71
-
72
-
73
-
74
-
75
-
76
-
77
-
78
-
79
-
80
-
81
-
82
-
83
-
84
-
85
-
86
-
87
-
88
-
89
-
90
-
91
-
92
-
93
-
94
-
95
-
96
-
97
-
98
-
99
-
100
-
101
-
102
-
103
-
104
-
105
-
106
-
107
-
108
-
109
-
110
-
111
-
112
-
113
-
114
-
115
-
116
-
117
-
118
-
119
-
120
-
121
-
122
-
123
-
124
-
125
 |
 |
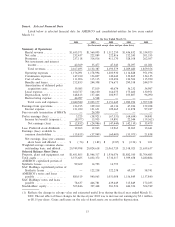
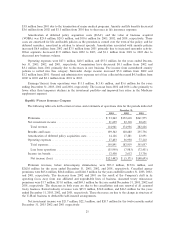
Fiscal 2004 Compared With Fiscal 2003
Revenues for AMERCO and its consolidated entities were $2,167.5 million for Ñscal year 2004. This
compares to $2,132.4 million for Ñscal year 2003. Earnings from operations were $126.9 million in Ñscal 2004
compared with $109.2 million for Ñscal year 2003. We experienced 6.4% revenue growth, before consolidating
entries, in our Moving and Self-Storage segment in Ñscal 2004 compared with Ñscal 2003. Combined earnings
from operations before consolidating entries, in our Moving and Self-Storage segments were $266.1 million in
Ñscal 2004, and reÖect an improvement of $70.3 million, or 35.9% in Ñscal 2004 compared with Ñscal 2003. At
the Oxford Life Insurance Company, revenue decreased 4.8% before eliminating entries, primarily as a result
of its rating downgrade by A.M. Best in 2003. This downgrade resulted from liquidity issues that faced
AMERCO. Earnings from operations at Oxford were $11.3 million in Ñscal 2004, reÖecting a reduction in
write-downs of investments due to other than temporary declines and a solid turnaround from the $1.4 million
loss reported in Ñscal 2003. At RepWest, revenues declined 34.3%, reÖecting its strategic decision to exit
unproÑtable non-U-Haul lines of business. The beneÑts and losses on these unproÑtable lines adversely
aÅected its proÑtability. As a result, earnings from operations at RepWest were a loss of $36.0 million in Ñscal
2004, compared with a loss of $8.0 million for Ñscal 2003.
Interest expense for Ñscal 2004 was $121.7 million. This compares to $148.1 million in Ñscal 2003, which
included our early termination of BBAT payments of $26.5 million. Income tax expense was $8.1 million in
Ñscal 2004 compared with a income tax beneÑt of $13.9 million in Ñscal 2003. This reÖects pretax earnings
and an increase in current year tax of $4.8 million as a result of our settlement with the IRS for tax audits
related to 1996 and 1997. As a result of the abovementioned items, there was a loss of $2.9 million in Ñscal
2004 compared with a loss of $25.0 million in Ñscal 2003. Included in Ñscal 2004 results are $44.1 million of
non-recurring Ñnancial restructuring costs ($27.3 million on an after-tax basis) compared with $6.6 million of
non-recurring Ñnancial restructuring costs ($4.0 million on an after-tax basis) included in Ñscal 2003.
Preferred stock dividends paid or accrued were $13.0 million in Ñscal 2004 and Ñscal 2003. Loss available to
common shareholders were a loss of $15.8 million in Ñscal 2004 compared to a loss of $37.9 million in Ñscal
2003.
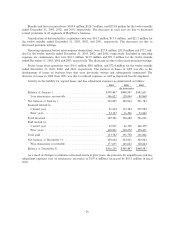
Fiscal 2003 Compared With Fiscal 2002
Revenues for AMERCO and its consolidated entities were $2,132.4 million for Ñscal 2003. This
compares to $2,193.6 million for Ñscal year 2003. Earnings from operations were $109.2 million in Ñscal 2003
compared with $42.1 million for Ñscal 2002, which included losses from RepWest of $72.4 million in Ñscal
2002 compared with losses of $8.0 million in Ñscal 2003. We experienced a 3.4% revenue growth, before
consolidating entries, in our Moving and Self-Storage segments in Ñscal 2003 compared with Ñscal 2002.
Combined earnings from operations, before consolidating entries, in our Moving and Self-Storage segments
were $195.8 million in Ñscal 2003, compared with $143.9 million in 2002, reÖecting an improvement of
$51.9 million, or 36.1% from Ñscal 2002. At the Oxford Life Insurance Company, revenue declined 4.0%.
Earnings from operations were a loss of $1.4 million in Ñscal 2003 compared with a proÑt of $5.6 million in
Ñscal 2002, reÖecting write-downs of investments due to other than temporary declines. At RepWest revenues
declined 38.1% in Ñscal 2003 compared with Ñscal 2002. Earnings from operations were a loss of $8.0 million
in Ñscal 2003 compared with a loss of $72.4 million in Ñscal 2002.
Interest expense for Ñscal 2003 was $148.1 million. This compares to $109.5 million in Ñscal 2002, and
includes our early termination of BBAT payments of $26.5 million in Ñscal 2003. Income tax beneÑt was
$13.9 million in Ñscal 2003 compared with an income tax beneÑt of $19.9 million in Ñscal 2002. This reÖects a
lower pretax earnings loss. Net loss was $25.0 million in Ñscal 2003 compared to $47.4 million in Ñscal 2002.
Preferred stock dividends paid or accrued were $13.0 million in Ñscal 2003 and Ñscal 2002. As a result of the
above mentioned items, our earnings (loss) available to common shareholders were a loss of $37.9 million in
Ñscal 2003 compared with the loss of $60.4 million in Ñscal 2002. Included in 2003 results are $6.6 million of
non-recurring Ñnancial restructuring costs ($4.0) million on after-tax basis). There were no non-recurring
Ñnancial restructuring costs in Ñscal 2002.
19