U-Haul 2004 Annual Report Download - page 39
Download and view the complete annual report
Please find page 39 of the 2004 U-Haul annual report below. You can navigate through the pages in the report by either clicking on the pages listed below, or by using the keyword search tool below to find specific information within the annual report.-
 1
1 -
2
-
3
-
4
-
5
-
6
-
7
-
8
-
9
-
10
-
11
-
12
-
13
-
14
-
15
-
16
-
17
-
18
-
19
-
20
-
21
-
22
-
23
-
24
-
25
-
26
-
27
-
28
-
 29
29 -
 30
30 -
 31
31 -
 32
32 -
 33
33 -
 34
34 -
 35
35 -
 36
36 -
 37
37 -
 38
38 -
 39
39 -
 40
40 -
 41
41 -
 42
42 -
 43
43 -
 44
44 -
 45
45 -
 46
46 -
 47
47 -
 48
48 -
 49
49 -
50
-
51
-
52
-
53
-
54
-
55
-
56
-
57
-
58
-
59
-
60
-
61
-
62
-
63
-
64
-
65
-
66
-
67
-
68
-
69
-
70
-
71
-
72
-
73
-
74
-
75
-
76
-
77
-
78
-
79
-
80
-
81
-
82
-
83
-
84
-
85
-
86
-
87
-
88
-
89
-
90
-
91
-
92
-
93
-
94
-
95
-
96
-
97
-
98
-
99
-
100
-
101
-
102
-
103
-
104
-
105
-
106
-
107
-
108
-
109
-
110
-
111
-
112
-
113
-
114
-
115
-
116
-
117
-
118
-
119
-
120
-
121
-
122
-
123
-
124
-
125
 |
 |

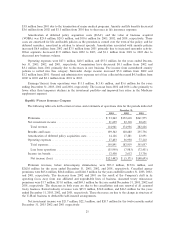
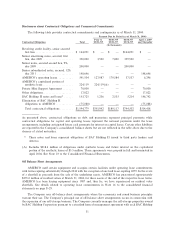
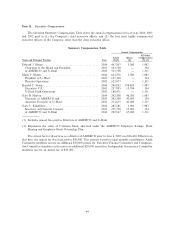
Quarterly Results (unaudited)
The quarterly results shown below are derived from unaudited Ñnancial statements for the eight quarters
beginning April 1, 2002 and ending March 31, 2004. The Company believes that all necessary adjustments
have been included in the amounts stated below to present fairly, and in accordance with generally accepted
accounting principles, such results. U-Haul moving and storage operations are seasonal and proportionally
more of the Company's revenues and net earnings from its U-Haul moving and self-storage operations are
generated in the Ñrst and second quarters of each Ñscal year (April through September). The operating results
for the periods presented are not necessarily indicative of results for any future period.
Quarter Ended
March 31, December 31, September 30, June 30,
2004 2003 2003 2003
(In thousands, except for share and per share data)
Total revenues ÏÏÏÏÏÏÏÏÏÏÏÏÏÏÏÏÏÏÏÏ $ 457,339 $ 502,583 $ 627,457 $ 580,116
Earnings/(loss) from operations ÏÏÏÏÏ (46,605) (1,030) 98,990 75,560
Net earnings (loss)ÏÏÏÏÏÏÏÏÏÏÏÏÏÏÏÏ (52,946) (21,667) 44,025 27,736
Earnings/(loss) available to common
shareholders ÏÏÏÏÏÏÏÏÏÏÏÏÏÏÏÏÏÏÏÏ (56,186) (24,908) 40,784 24,495
Weighted average common shares
outstanding basic and diluted ÏÏÏÏÏ 20,774,689 20,757,297 20,744,692 20,732,086
Earnings (loss) per common share
basic and diluted ÏÏÏÏÏÏÏÏÏÏÏÏÏÏÏÏ $ (2.70) $ (1.20)* $ 1.97* $ 1.18*
Quarter Ended
March 31, December 31, September 30, June 30,
2003 2002 2002 2002
(In thousands, except for share and per share data)
Total revenues ÏÏÏÏÏÏÏÏÏÏÏÏÏÏÏÏÏÏÏÏ $ 448,997 $ 467,223 $ 636,874 $ 579,294
Earnings/(loss) from operations ÏÏÏÏÏ (10,534) (6,722) 62,869 63,597
Net earnings (loss)ÏÏÏÏÏÏÏÏÏÏÏÏÏÏÏÏ (25,110) (45,783) 22,128 23,779
Earnings/(loss) available to common
shareholders ÏÏÏÏÏÏÏÏÏÏÏÏÏÏÏÏÏÏÏÏ (28,351) (49,024) 18,887 20,538
Weighted average common shares
outstanding basic and diluted ÏÏÏÏÏ 20,749,681 20,752,204 20,812,686 20,946,168
Earnings (loss) per common share
basic and diluted ÏÏÏÏÏÏÏÏÏÏÏÏÏÏÏÏ $ (1.37)* $ (2.36)* $ 0.91* $ 0.98*
* Amounts revised to reÖect the corrected number of weighted average common shares outstanding.
The weighted average common shares increased (decreased) by approximately 353,000; 33,000; (11,000);
(87,000); 906,000; 230,000; and 657,000 for the seven quarters ending December 31, 2003, respectively. The
eÅect of including these shares was to increase (decrease) earnings (loss) per share by $.02; $.00; $.00; $.01;
$.05; $.02; $(.04); for the seven quarters ended December 31, 2003, respectively.
The eÅect of including these shares was to increase (decrease) earnings (loss) per share by $.02; $.00; $.00;
$.01; $.05; $.02; $(.04); for the seven quarters ended December 31, 2003, respectively.
34