U-Haul 2004 Annual Report Download - page 100
Download and view the complete annual report
Please find page 100 of the 2004 U-Haul annual report below. You can navigate through the pages in the report by either clicking on the pages listed below, or by using the keyword search tool below to find specific information within the annual report.-
 1
1 -
2
-
3
-
4
-
5
-
6
-
7
-
8
-
9
-
10
-
11
-
12
-
13
-
14
-
15
-
16
-
17
-
18
-
19
-
20
-
21
-
22
-
23
-
24
-
25
-
26
-
27
-
28
-
29
-
30
-
31
-
32
-
33
-
34
-
35
-
36
-
37
-
38
-
39
-
40
-
41
-
42
-
43
-
44
-
45
-
46
-
47
-
48
-
49
-
50
-
51
-
52
-
53
-
54
-
55
-
56
-
57
-
58
-
59
-
60
-
61
-
62
-
63
-
64
-
65
-
66
-
67
-
68
-
69
-
70
-
71
-
72
-
73
-
74
-
75
-
76
-
77
-
78
-
79
-
80
-
81
-
82
-
83
-
84
-
85
-
86
-
87
-
88
-
89
-
 90
90 -
 91
91 -
 92
92 -
 93
93 -
 94
94 -
 95
95 -
 96
96 -
 97
97 -
 98
98 -
 99
99 -
 100
100 -
 101
101 -
 102
102 -
 103
103 -
 104
104 -
 105
105 -
 106
106 -
 107
107 -
 108
108 -
 109
109 -
 110
110 -
111
-
112
-
113
-
114
-
115
-
116
-
117
-
118
-
119
-
120
-
121
-
122
-
123
-
124
-
125
 |
 |

F-39
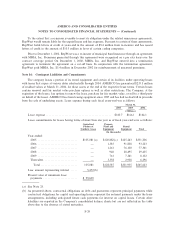
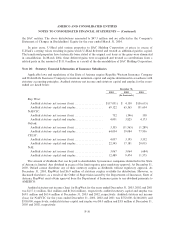
AMERCO AND CONSOLIDATED ENTITIES
NOTES TO CONSOLIDATED FINANCIAL STATEMENTS Ì (Continued)
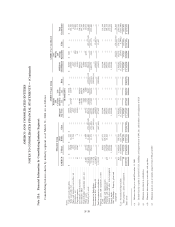
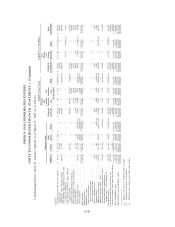
Note 21A: Financial Information by Consolidating Industry Segment:
Consolidating balance sheets by industry segment as of March 31, 2004 are as follows:
AMERCO Legal Group AMERCO as Consolidated
Property SAC
and Moving
Obligated Group Casualty Life and
Real Obligated Insurance Insurance AMERCO Storage Total
AMERCO U-Haul Estate Elim Grp Cons (a) (a) Elim Consolidated Operations Elim Consolidated
(In thousands)
Assets:
Cash and cash equivalents ÏÏÏÏÏÏÏÏÏÏÏÏÏÏ $ Ì $ 64,717 $ 661 $ Ì $ 65,378 $ Ì $ 15,168 $ Ì $ 80,546 $ 1,011 $ Ì $ 81,557
Trade receivables, netÏÏÏÏÏÏÏÏÏÏÏÏÏÏÏÏÏÏ Ì 13,404 14,856 Ì 28,260 223,747 16,379 Ì 268,386 Ì Ì 268,386
Notes and mortgage receivables, net ÏÏÏÏÏ Ì 2,973 1,564 Ì 4,537 Ì Ì Ì 4,537 Ì Ì 4,537
Inventories, net ÏÏÏÏÏÏÏÏÏÏÏÏÏÏÏÏÏÏÏÏÏÏÏ Ì 51,922 Ì Ì 51,922 Ì Ì Ì 51,922 880 Ì 52,802
Prepaid expensesÏÏÏÏÏÏÏÏÏÏÏÏÏÏÏÏÏÏÏÏÏÏ 81 12,947 2 Ì 13,030 Ì Ì Ì 13,030 142 Ì 13,172
Investments, Ñxed maturitiesÏÏÏÏÏÏÏÏÏÏÏÏ Ì Ì Ì Ì Ì 148,903 560,450 Ì 709,353 Ì Ì 709,353
Investments, other ÏÏÏÏÏÏÏÏÏÏÏÏÏÏÏÏÏÏÏÏ Ì Ì Ì Ì Ì 143,163 204,374 Ì 347,537 Ì Ì 347,537
Deferred policy acquisition costs, net ÏÏÏÏÏ Ì Ì Ì Ì Ì 3,843 73,096 Ì 76,939 Ì Ì 76,939
Other assets ÏÏÏÏÏÏÏÏÏÏÏÏÏÏÏÏÏÏÏÏÏÏÏÏÏÏ 26,001 26,762 2,989 Ì 55,752 3,686 1,000 Ì 60,438 4,633 Ì 65,071
Related party assets ÏÏÏÏÏÏÏÏÏÏÏÏÏÏÏÏÏÏÏ 531,458 397,406 13,300 (551,450)(d) 390,714 104,543 50,187 (155,341)(d) 390,103 Ì (85,657)(d) 304,446
557,540 570,131 33,372 (551,450) 609,593 627,885 920,654 (155,341) 2,002,791 6,666 (85,657) 1,923,800
Investment in SubsidiariesÏÏÏÏÏÏÏÏÏÏÏÏÏÏÏÏ 1,137,579 Ì Ì (847,545)(c) 290,034 Ì Ì (290,034)(c) Ì Ì Ì Ì
Investment in SAC Holding II ÏÏÏÏÏÏÏÏÏÏÏÏ (12,427) Ì Ì Ì (12,427) Ì Ì Ì (12,427) Ì 12,427(c) Ì
Total investment in subsidiaries ÏÏÏÏÏÏÏÏÏÏÏ 1,125,152 Ì Ì (847,545) 277,607 Ì Ì (290,034) (12,427) Ì 12,427 Ì
Property, plant, and equipment, at cost:
Land ÏÏÏÏÏÏÏÏÏÏÏÏÏÏÏÏÏÏÏÏÏÏÏÏÏÏÏÏÏÏÏÏ Ì 20,923 137,671 Ì 158,594 Ì Ì Ì 158,594 Ì Ì 158,594
Buildings and improvements ÏÏÏÏÏÏÏÏÏÏÏÏ Ì 271,223 603,762 Ì 874,985 Ì Ì Ì 874,985 Ì Ì 874,985
Furniture and equipment ÏÏÏÏÏÏÏÏÏÏÏÏÏÏÏ 413 274,600 18,102 Ì 293,115 Ì Ì Ì 293,115 Ì Ì 293,115
Rental trailers and other rental equipment Ì 159,586 Ì Ì 159,586 Ì Ì Ì 159,586 Ì Ì 159,586
Rental trucks ÏÏÏÏÏÏÏÏÏÏÏÏÏÏÏÏÏÏÏÏÏÏÏÏÏ Ì 1,219,002 Ì Ì 1,219,002 Ì Ì Ì 1,219,002 Ì Ì 1,219,002
SAC Holdings Ì Property, plant and
equipment ÏÏÏÏÏÏÏÏÏÏÏÏÏÏÏÏÏÏÏÏÏÏÏÏÏ Ì Ì Ì Ì Ì Ì Ì Ì Ì 152,575 (74,212)(e) 78,363
413 1,945,334 759,535 Ì 2,705,282 Ì Ì Ì 2,705,282 152,575 (74,212) 2,783,645
Less: Accumulated depreciation ÏÏÏÏÏÏÏÏÏÏÏ (353) (1,069,605) (265,279) Ì (1,335,237) Ì Ì Ì (1,335,237) (5,147) 8,544(e) (1,331,840)
Total property, plant and equipmentÏÏÏÏÏÏ 60 875,729 494,256 Ì 1,370,045 Ì Ì Ì 1,370,045 147,428 (65,668) 1,451,805
Total assets ÏÏÏÏÏÏÏÏÏÏÏÏÏÏÏÏÏÏÏÏÏÏÏÏÏÏÏÏ $1,682,752 $ 1,445,860 $ 527,628 $(1,398,995) $ 2,257,245 $627,885 $920,654 $(445,375) $ 3,360,409 $154,094 $(138,898) $ 3,375,605
(a) Balances for the year ended December 31, 2003
(b) Included in this caption is land of $57,123, buildings and improvements of $95,326, and furniture and equipment of $126
(c) Eliminate investment in subsidiaries
(d) Eliminate intercompany receivables and payables
(e) Eliminate gain on sale of surplus property from U-Haul to SAC