U-Haul 2004 Annual Report Download - page 113
Download and view the complete annual report
Please find page 113 of the 2004 U-Haul annual report below. You can navigate through the pages in the report by either clicking on the pages listed below, or by using the keyword search tool below to find specific information within the annual report.-
 1
1 -
2
-
3
-
4
-
5
-
6
-
7
-
8
-
9
-
10
-
11
-
12
-
13
-
14
-
15
-
16
-
17
-
18
-
19
-
20
-
21
-
22
-
23
-
24
-
25
-
26
-
27
-
28
-
29
-
30
-
31
-
32
-
33
-
34
-
35
-
36
-
37
-
38
-
39
-
40
-
41
-
42
-
43
-
44
-
45
-
46
-
47
-
48
-
49
-
50
-
51
-
52
-
53
-
54
-
55
-
56
-
57
-
58
-
59
-
60
-
61
-
62
-
63
-
64
-
65
-
66
-
67
-
68
-
69
-
70
-
71
-
72
-
73
-
74
-
75
-
76
-
77
-
78
-
79
-
80
-
81
-
82
-
83
-
84
-
85
-
86
-
87
-
88
-
89
-
90
-
91
-
92
-
93
-
94
-
95
-
96
-
97
-
98
-
99
-
100
-
101
-
102
-
 103
103 -
 104
104 -
 105
105 -
 106
106 -
 107
107 -
 108
108 -
 109
109 -
 110
110 -
 111
111 -
 112
112 -
 113
113 -
 114
114 -
 115
115 -
 116
116 -
 117
117 -
 118
118 -
 119
119 -
 120
120 -
 121
121 -
 122
122 -
 123
123 -
124
-
125
 |
 |

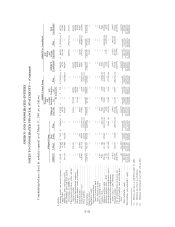
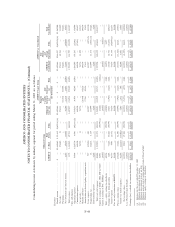
ADDITIONAL INFORMATION
NOTES TO SUMMARY OF EARNINGS OF INDEPENDENT RENTAL FLEETS
(A) The accompanying Summary of Earnings of Independent Rental Fleets includes the operations of
rental equipment under the brand name of ""U-Haul'' owned by independent Öeet owners. Earnings data
represent the aggregate results of operations before depreciation and taxes. Investment data represent the cost
of the rental equipment and investments before accumulated depreciation.
Fleet owner income is based on Independent Rental Dealer reports of rentals transacted through the day
preceding the last Monday of each month and received by U-Haul International, Inc. by the end of the month
and U-Haul Center reports of rentals transacted through the last day of each month. Payments to Öeet owners
for trailers lost or retired from rental service as a result of damage by accident have not been reÖected in this
summary because such payments do not relate to earnings before depreciation and income taxes but, rather,
investment (depreciation).
The investment data is based upon the cost of the rental equipment to the Öeet owners as reÖected by
sales records of the U-Haul manufacturing facilities.
(B) The summary of earnings data stated in terms of amount per $100 of average investment represents
the aggregate results of operations (earnings data) divided by the average amount of investment during the
periods. The average amount of investment is based upon a simple average of the month-end investment
during each period. Average earnings data is not necessarily representative of an individual Öeet owner's
earnings.
(C) A summary of operations expenses charged directly to independent Öeet owners follows:
Years Ended March 31,
2004 2003 2002 2001 2000
(In thousands)
LicensesÏÏÏÏÏÏÏÏÏÏÏÏÏÏÏÏÏÏÏÏÏÏÏÏÏÏÏÏÏÏÏÏÏÏÏÏÏÏÏÏÏÏ $ 41 $ 52 $ 86 $124 $150
Public liability insurance ÏÏÏÏÏÏÏÏÏÏÏÏÏÏÏÏÏÏÏÏÏÏÏÏÏÏÏÏ 48 53 65 87 126
Repairs and maintenance ÏÏÏÏÏÏÏÏÏÏÏÏÏÏÏÏÏÏÏÏÏÏÏÏÏÏÏ 348 317 381 508 723
$437 $422 $532 $719 $999
(D) The Öeet owners and subsidiary U-Haul rental companies forego normal commissions on a portion
of gross rental fees designated for transfer to the Trailer Accident Fund. Trailer accident repair expenses,
otherwise chargeable to Öeet owners, are paid from this Fund to the extent of the Ñnancial resources of the
Fund. The amounts designated ""Trailer Accident Fund credit'' in the accompanying summary of earnings
represents independent Öeet owner commissions foregone, which exceed expenses borne by the Fund.
(E) Commissions foregone for transfer to the Trailer Accident Fund follow:
Fleet Owners
Subsidiary
U-Haul Subsidiary
Companies Companies Independent Total
(In thousands)
Year ended:
March 31, 2004 ÏÏÏÏÏÏÏÏÏÏÏÏÏÏÏÏÏÏÏÏÏÏÏÏÏÏÏÏ $7,704 $4,102 $ 46 $11,852
March 31, 2003 ÏÏÏÏÏÏÏÏÏÏÏÏÏÏÏÏÏÏÏÏÏÏÏÏÏÏÏÏ 6,845 3,637 49 10,531
March 31, 2002 ÏÏÏÏÏÏÏÏÏÏÏÏÏÏÏÏÏÏÏÏÏÏÏÏÏÏÏÏ 6,385 3,377 61 9,823
March 31, 2001 ÏÏÏÏÏÏÏÏÏÏÏÏÏÏÏÏÏÏÏÏÏÏÏÏÏÏÏÏ 6,073 3,191 79 9,343
March 31, 2000 ÏÏÏÏÏÏÏÏÏÏÏÏÏÏÏÏÏÏÏÏÏÏÏÏÏÏÏÏ 6,061 3,150 114 9,325
F-52