U-Haul 2004 Annual Report Download - page 18
Download and view the complete annual report
Please find page 18 of the 2004 U-Haul annual report below. You can navigate through the pages in the report by either clicking on the pages listed below, or by using the keyword search tool below to find specific information within the annual report.
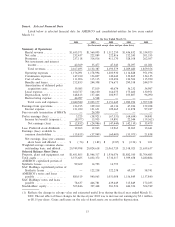
Item 6. Selected Financial Data
Listed below is selected Ñnancial data for AMERCO and consolidated entities for Ñve years ended
March 31:
For the Year Ended March 31,
2004 2003 2002 2001 2000
(In thousands except share and per share data)
Summary of Operations:
Rental revenue ÏÏÏÏÏÏÏÏÏÏÏÏÏÏÏÏ $1,655,571 $1,560,005 $ 1,512,250 $1,436,832 $1,334,923
Net sales ÏÏÏÏÏÏÏÏÏÏÏÏÏÏÏÏÏÏÏÏÏ 232,437 222,889 222,816 212,243 201,355
Premiums ÏÏÏÏÏÏÏÏÏÏÏÏÏÏÏÏÏÏÏÏ 237,118 314,016 411,170 328,108 262,057
Net investment and interest
incomeÏÏÏÏÏÏÏÏÏÏÏÏÏÏÏÏÏÏÏÏÏ 42,369 35,477 47,343 52,297 61,021
Total revenues ÏÏÏÏÏÏÏÏÏÏÏÏÏÏ 2,167,495 2,132,387 2,193,579 2,029,480 1,859,356
Operating expenses ÏÏÏÏÏÏÏÏÏÏÏÏ 1,176,091 1,178,994 1,203,930 1,116,828 951,196
Commission expenses ÏÏÏÏÏÏÏÏÏÏ 147,010 136,827 140,442 132,865 134,135
Cost of sales ÏÏÏÏÏÏÏÏÏÏÏÏÏÏÏÏÏÏ 111,906 115,115 122,694 126,506 115,390
BeneÑts and losses ÏÏÏÏÏÏÏÏÏÏÏÏÏ 212,853 244,308 376,673 290,558 244,579
Amortization of deferred policy
acquisition costs ÏÏÏÏÏÏÏÏÏÏÏÏÏ 39,083 37,819 40,674 36,232 34,987
Lease expenseÏÏÏÏÏÏÏÏÏÏÏÏÏÏÏÏÏ 160,727 166,100 164,075 175,460 130,951
Depreciation, net(1) ÏÏÏÏÏÏÏÏÏÏÏ 148,813 137,446 102,957 103,807 96,090
Restructuring expense ÏÏÏÏÏÏÏÏÏÏ 44,097 6,568 Ì Ì Ì
Total costs and expenses ÏÏÏÏÏÏ 2,040,580 2,023,177 2,151,445 1,982,256 1,707,328
Earnings from operations ÏÏÏÏÏÏÏÏÏ 126,915 109,210 42,134 47,224 152,028
Interest expense ÏÏÏÏÏÏÏÏÏÏÏÏÏÏÏ 121,690 121,631 109,465 111,878 97,187
Fees on early termination of BBATs Ì 26,500 Ì Ì Ì
Pretax earnings (loss) ÏÏÏÏÏÏÏÏÏÏÏÏ 5,225 (38,921) (67,331) (64,654) 54,841
Income tax beneÑt (expense)ÏÏÏÏ (8,077) 13,935 19,891 22,544 (19,362)
Net earnings (loss) ÏÏÏÏÏÏÏÏÏÏ $ (2,852) $ (24,986) $ (47,440) $ (42,110) $ 35,479
Less: Preferred stock dividends ÏÏÏÏ 12,963 12,963 12,963 12,963 13,641
Earnings (loss) available to
common shareholders ÏÏÏÏÏÏÏÏÏÏ (15,815) (37,949) (60,403) (55,073) 21,838
Net earnings (loss) per common
share basic and diluted ÏÏÏÏÏÏÏ $ (.76) $ (1.82) $ (2.87) $ (2.56) $ 1.01
Weighted average common shares
outstanding basic and diluted ÏÏÏÏ 20,749,998 20,824,618 21,063,720 21,518,025 21,659,637
Selected Balance Sheet Data:
Property, plant and equipment, net $1,451,805 $1,946,317 $ 1,936,076 $1,882,010 $1,704,483
Total assets ÏÏÏÏÏÏÏÏÏÏÏÏÏÏÏÏÏÏÏÏÏ 3,375,605 3,832,372 3,732,317 3,599,658 3,280,884
AMERCO capitalized portion of
Synthetic leases ÏÏÏÏÏÏÏÏÏÏÏÏÏÏÏÏÏ 99,609 14,793 14,793 Ì Ì
SAC Holdings capitalized portion of
Synthetic leases ÏÏÏÏÏÏÏÏÏÏÏÏÏÏÏ Ì 122,238 122,238 60,297 58,741
AMERCO's notes and loans
payable ÏÏÏÏÏÏÏÏÏÏÏÏÏÏÏÏÏÏÏÏÏÏ 880,519 940,063 1,031,008 1,156,849 1,137,840
SAC Holdings' notes and loans
payable ÏÏÏÏÏÏÏÏÏÏÏÏÏÏÏÏÏÏÏÏÏÏ 78,637 466,781 439,649 315,849 172,035
Stockholders' equityÏÏÏÏÏÏÏÏÏÏÏÏÏÏ 503,846 327,448 381,524 446,354 504,749
(1) ReÖects the change in salvage value and estimated useful lives during the Ñscal year ended March 31,
2002. The net eÅect of these changes for the Ñscal year 2002 was to increase net earnings by $3.1 million
or $0.15 per share. Gains and losses on the sale of Ñxed assets are recorded in depreciation.
13


