U-Haul 2004 Annual Report Download - page 29
Download and view the complete annual report
Please find page 29 of the 2004 U-Haul annual report below. You can navigate through the pages in the report by either clicking on the pages listed below, or by using the keyword search tool below to find specific information within the annual report.-
 1
1 -
2
-
3
-
4
-
5
-
6
-
7
-
8
-
9
-
10
-
11
-
12
-
13
-
14
-
15
-
16
-
17
-
18
-
 19
19 -
 20
20 -
 21
21 -
 22
22 -
 23
23 -
 24
24 -
 25
25 -
 26
26 -
 27
27 -
 28
28 -
 29
29 -
 30
30 -
 31
31 -
 32
32 -
 33
33 -
 34
34 -
 35
35 -
 36
36 -
 37
37 -
 38
38 -
 39
39 -
40
-
41
-
42
-
43
-
44
-
45
-
46
-
47
-
48
-
49
-
50
-
51
-
52
-
53
-
54
-
55
-
56
-
57
-
58
-
59
-
60
-
61
-
62
-
63
-
64
-
65
-
66
-
67
-
68
-
69
-
70
-
71
-
72
-
73
-
74
-
75
-
76
-
77
-
78
-
79
-
80
-
81
-
82
-
83
-
84
-
85
-
86
-
87
-
88
-
89
-
90
-
91
-
92
-
93
-
94
-
95
-
96
-
97
-
98
-
99
-
100
-
101
-
102
-
103
-
104
-
105
-
106
-
107
-
108
-
109
-
110
-
111
-
112
-
113
-
114
-
115
-
116
-
117
-
118
-
119
-
120
-
121
-
122
-
123
-
124
-
125
 |
 |

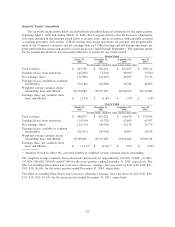
Earnings from operations at U-Haul, before consolidating entries, were $71.0 million in Ñscal 2003,
compared with $30.4 million in 2002. This represents an increase of $40.6 million, or 133.6%, and was driven
by increased rental revenues and lower expenses resulting from the sale of several retail centers to SAC
Holdings and a cost reduction program. Earnings from operations at SAC Holdings, before consolidating
entries, were $68.8 million in Ñscal 2003, compared with $41.7 million in 2002. This represents an increase of
$27.1 million, or 65.0%, and was driven by the acquisition of several locations from U-Haul. Earnings from
operations at Real Estate, before consolidating entries, were $56.0 million in Ñscal 2003, compared with
$71.9 million in 2002. This represents a decrease of $15.9 million, or 22.1%, and was driven by a reduction in
rental revenues and reductions in gains on asset disposals.
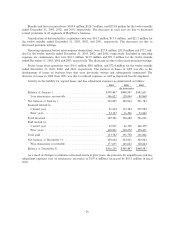
Oxford Life Insurance Company
The following table sets forth certain net revenue and statements of operations data for the periods
indicated:
December 31,
2003 2002 2001
(In thousands)
PremiumsÏÏÏÏÏÏÏÏÏÏÏÏÏÏÏÏÏÏÏÏÏÏÏÏÏÏÏÏÏÏÏÏÏÏÏÏÏÏÏÏÏÏÏÏ $147,753 $161,398 $159,380
Net investment income ÏÏÏÏÏÏÏÏÏÏÏÏÏÏÏÏÏÏÏÏÏÏÏÏÏÏÏÏÏÏÏÏ 19,046 13,891 23,175
Total revenueÏÏÏÏÏÏÏÏÏÏÏÏÏÏÏÏÏÏÏÏÏÏÏÏÏÏÏÏÏÏÏÏÏÏÏÏÏÏÏ 166,799 175,289 182,555
BeneÑts and losses ÏÏÏÏÏÏÏÏÏÏÏÏÏÏÏÏÏÏÏÏÏÏÏÏÏÏÏÏÏÏÏÏÏÏÏÏ 103,491 115,628 120,917
Amortization of deferred policy acquisition costs ÏÏÏÏÏÏÏÏÏÏÏ 24,957 20,538 18,583
Operating expenses ÏÏÏÏÏÏÏÏÏÏÏÏÏÏÏÏÏÏÏÏÏÏÏÏÏÏÏÏÏÏÏÏÏÏÏÏ 27,098 40,549 37,473
Total expenses ÏÏÏÏÏÏÏÏÏÏÏÏÏÏÏÏÏÏÏÏÏÏÏÏÏÏÏÏÏÏÏÏÏÏÏÏÏÏ 155,546 176,715 176,973
Income (loss) from operations ÏÏÏÏÏÏÏÏÏÏÏÏÏÏÏÏÏÏÏÏÏÏÏÏ 11,253 (1,426) 5,582
Income tax beneÑt (expense) ÏÏÏÏÏÏÏÏÏÏÏÏÏÏÏÏÏÏÏÏÏÏÏÏÏÏÏ (4,493) 549 (2,418)
Net income (loss) ÏÏÏÏÏÏÏÏÏÏÏÏÏÏÏÏÏÏÏÏÏÏÏÏÏÏÏÏÏÏÏÏÏÏ $ 6,760 $ (877) $ 3,164
Premium revenues, before intercompany eliminations, were $147.8 million, $161.4 million, and
$159.4 million for the year ended December 31, 2003, 2002, and 2001, respectively. Oxford's Medicare
supplement premiums decreased by $3.5 million from 2002. Within this line of business run-oÅ programs had
premium decreases of $7.7 million due to lapses; this was oÅset by new writings from Christian Fidelity Life
Insurance Company (CFLIC) of $4.2 million. Medicare supplement premiums increased $2.8 million from
2001 primarily due to new CFLIC premiums. Premiums from Oxford's life insurance lines decreased
$4.1 million from 2002 and $1.6 million from 2001. Credit life and disability premiums decreased $4.8 million
from 2002 and $7.7 million from 2001 due to account cancellations and decreased penetration. Annuitizations
decreased by $0.3 million from 2002 and $1.0 million from 2001. Other health insurance premiums decreased
$0.9 million from 2002 and decreased $4.1 million from 2001 due to the termination of major medical
programs.
Net investment income before intercompany eliminations was $19.0 million, $13.9 million, and
$23.2 million for the years ended December 31, 2003, 2002 and 2001, respectively. The increase from 2002 is
due to $6.0 million fewer capital losses and limited partnership losses oÅset by a lower invested asset base and
reduced reinvestment rates. The change from 2001 is due primarily to lower reinvestment rates.
BeneÑts and losses incurred were $103.5 million, $115.6 million, and $120.9 million for the years ended
December 31, 2003, 2002 and 2001, respectively. Medicare supplement beneÑts decreased $6.5 million from
2002 and $8.3 million from 2001 primarily due to decreased exposure and improved experience. Credit
insurance beneÑts decreased $2.3 million from 2002 and $4.0 million from 2001 due to decreased exposure.
BeneÑts from other health lines increased $0.3 million from 2002 due to increased morbidity and decreased
24