TomTom 2011 Annual Report Download - page 9
Download and view the complete annual report
Please find page 9 of the 2011 TomTom annual report below. You can navigate through the pages in the report by either clicking on the pages listed below, or by using the keyword search tool below to find specific information within the annual report.-
 1
1 -
 2
2 -
 3
3 -
 4
4 -
 5
5 -
 6
6 -
 7
7 -
 8
8 -
 9
9 -
 10
10 -
 11
11 -
 12
12 -
 13
13 -
 14
14 -
 15
15 -
 16
16 -
 17
17 -
 18
18 -
 19
19 -
 20
20 -
21
-
22
-
23
-
24
-
25
-
26
-
27
-
28
-
29
-
30
-
31
-
32
-
33
-
34
-
35
-
36
-
37
-
38
-
39
-
40
-
41
-
42
-
43
-
44
-
45
-
46
-
47
-
48
-
49
-
50
-
51
-
52
-
53
-
54
-
55
-
56
-
57
-
58
-
59
-
60
-
61
-
62
-
63
-
64
-
65
-
66
-
67
-
68
-
69
-
70
-
71
-
72
-
73
-
74
-
75
-
76
-
77
-
78
-
79
-
80
-
81
-
82
-
83
-
84
-
85
-
86
-
87
-
88
 |
 |

7
In addition, we entered the car lease industry during the year
through a partnership with private lease company Mijndomein
Auto. This service offers consumers and businesses the
opportunity to lease a car equipped with TomTom Business
Solutions technology that helps to reduce the car’s CO2 emissions
by giving drivers instant feedback on their driving behaviour and
fuel consumption.
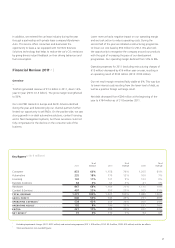
Financial Review 20111, 2 |
Overview
—
TomTom generated revenue of €1.3 billion in 2011, down 16%
year-on-year (2010: €1.5 billion). The gross margin strengthened
to 50%.
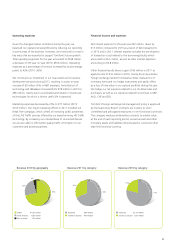
Our core PND markets in Europe and North America declined
during the year, and destocking by our channel partners further
limited our opportunity to sell PNDs. On the positive side, we saw
strong growth in in-dash automotive solutions, content licensing
and in fl eet management systems, but these successes could not
fully compensate for the decline on the consumer side of the
business.
Key fi gures1, 2 (in € millions)
2011
% of
revenue 2010
% of
revenue 2009
% of
revenue
Consumer 833 66% 1,158 76% 1,205 81%
Automotive 235 18% 179 12% 100 7%
Licensing 142 11% 131 9% 133 9%
Business Solutions 64 5% 53 3% 41 3%
Hardware 867 68% 1,164 77% 1,175 79%
Content & Services 407 32% 357 23% 305 21%
TOTAL REVENUE 1,273 100% 1,521 100% 1,480 100%
GROSS PROFIT 640 50% 744 49% 731 49%
OPERATING EXPENSES1538 42% 554 36% 500 34%
OPERATING RESULT 102 8% 190 12% 231 16%
EBITDA 221 17% 299 20% 337 23%
NET RESULT173 6% 110 7% 94 6%
Lower revenue had a negative impact on our operating margin
and we took action to reduce operating costs. During the
second half of the year we initiated a restructuring programme
to lower our cost base by €50 million for 2012. We also took
the opportunity to reorganise the company around our products
with the goal of increasing the pace of our development
programmes. Our operating margin declined from 12% to 8%.
Operating expenses for 2011 (excluding restructuring charges of
€15 million) decreased by €16 million year-on-year, resulting in
an operating result of €102 million (2010: €190 million).
Our net result margin remained fairly stable at 6%. This was due
to lower interest costs resulting from the lower level of debt, as
well as a positive foreign exchange result.
Net debt decreased from €294 million at the beginning of the
year to €194 million as of 31 December 2011.
¹ Excluding impairment charges (2011: €512 million) and restructuring expenses (2011: €15 million, 2010: €3.3 million, 2009: €10 million) and the tax effects.
² Totals are based on non-rounded fi gures.