TomTom 2011 Annual Report Download - page 70
Download and view the complete annual report
Please find page 70 of the 2011 TomTom annual report below. You can navigate through the pages in the report by either clicking on the pages listed below, or by using the keyword search tool below to find specific information within the annual report.-
 1
1 -
2
-
3
-
4
-
5
-
6
-
7
-
8
-
9
-
10
-
11
-
12
-
13
-
14
-
15
-
16
-
17
-
18
-
19
-
20
-
21
-
22
-
23
-
24
-
25
-
26
-
27
-
28
-
29
-
30
-
31
-
32
-
33
-
34
-
35
-
36
-
37
-
38
-
39
-
40
-
41
-
42
-
43
-
44
-
45
-
46
-
47
-
48
-
49
-
50
-
51
-
52
-
53
-
54
-
55
-
56
-
57
-
58
-
59
-
 60
60 -
 61
61 -
 62
62 -
 63
63 -
 64
64 -
 65
65 -
 66
66 -
 67
67 -
 68
68 -
 69
69 -
 70
70 -
 71
71 -
 72
72 -
 73
73 -
 74
74 -
 75
75 -
 76
76 -
 77
77 -
 78
78 -
 79
79 -
 80
80 -
81
-
82
-
83
-
84
-
85
-
86
-
87
-
88
 |
 |

TomTom Annual Report and Accounts 2011
68
Notes to the Consolidated Financial Statements | continued
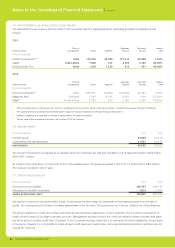
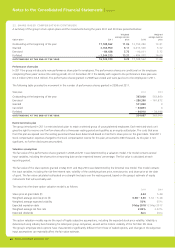
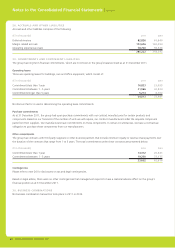
24. BORROWINGS (CONTINUED)
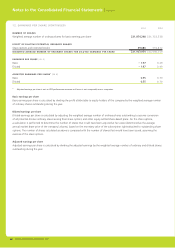
Finance leases
These are fi nance leases for plant and machinery, cars and equipment. The net book value of the assets related to these leases is nil
(2010: €1.2 million). Future minimum lease payments are as follows:
(€ in thousands) 2011 2010
Commitments less than 1 year 01,016
Commitments between 1 – 5 years 0201
Commitments longer than 5 years 0 1
TOTAL MINIMUM LEASE PAYMENTS 0 1,218
Less amounts representing fi nance charges 0 – 29
PRESENT VALUE OF MINIMUM LEASE PAYMENTS 01,189
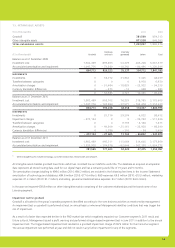
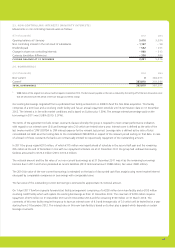
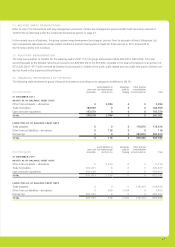
25. DEFERRED INCOME TAX
As at 31 December 2011, the group has a deferred tax liability of €182 million (2010: €211 million). A deferred tax asset has been recorded
amounting to €10 million (2010: €22 million). The deferred tax asset and deferred tax liability result from timing differences between the
tax and accounting treatment of the amortisation of intangible assets, tax-loss carry-forwards and certain provisions.
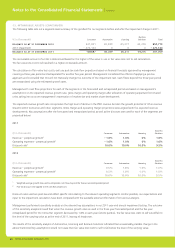
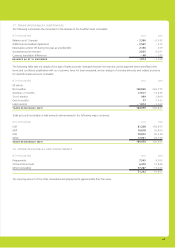
(€ in thousands) 2011 2010
DEFERRED TAX
To be realised after more than 12 months – 168,621 – 187,205
To be realised within 12 months – 3,159 – 1,544
– 171,780 – 188,749
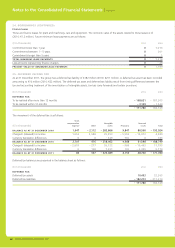
The movement of the deferred tax is as follows:
(€ in thousands)
Stock
compensation
expense Other
Intangible
assets Provisions
Assessed
losses Total
BALANCE AS AT 31 DECEMBER 2009 1,647 – 2,112 – 283,866 9,847 80,560 – 193,924
Charged / (released) to income 1,054 2,588 25,953 – 5,594 – 19,012 4,989
Currency translation differences 0 0 – 549 735 0 186
BALANCE AS AT 31 DECEMBER 2010 2,701 476 – 258,462 4,988 61,548 – 188,749
Charged / (released) to income – 2,619 – 277 26,122 – 968 – 10,463 11,795
Currency translation differences 0 138 7,251 130 – 2,345 5,174
BALANCE AS AT 31 DECEMBER 2011 82 337 – 225,089 4,150 48,740 – 171,780
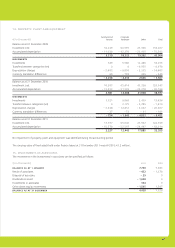
Deferred tax balances are presented in the balance sheet as follows:
(€ in thousands) 2011 2010
DEFERRED TAX
Deferred tax assets 10,493 22,265
Deferred tax liabilities – 182,273 – 211,014
– 171,780 – 188,749