TomTom 2011 Annual Report Download - page 12
Download and view the complete annual report
Please find page 12 of the 2011 TomTom annual report below. You can navigate through the pages in the report by either clicking on the pages listed below, or by using the keyword search tool below to find specific information within the annual report.-
 1
1 -
 2
2 -
 3
3 -
 4
4 -
 5
5 -
 6
6 -
 7
7 -
 8
8 -
 9
9 -
 10
10 -
 11
11 -
 12
12 -
 13
13 -
 14
14 -
 15
15 -
 16
16 -
 17
17 -
 18
18 -
 19
19 -
 20
20 -
 21
21 -
 22
22 -
23
-
24
-
25
-
26
-
27
-
28
-
29
-
30
-
31
-
32
-
33
-
34
-
35
-
36
-
37
-
38
-
39
-
40
-
41
-
42
-
43
-
44
-
45
-
46
-
47
-
48
-
49
-
50
-
51
-
52
-
53
-
54
-
55
-
56
-
57
-
58
-
59
-
60
-
61
-
62
-
63
-
64
-
65
-
66
-
67
-
68
-
69
-
70
-
71
-
72
-
73
-
74
-
75
-
76
-
77
-
78
-
79
-
80
-
81
-
82
-
83
-
84
-
85
-
86
-
87
-
88
 |
 |

TomTom Annual Report and Accounts 2011
10
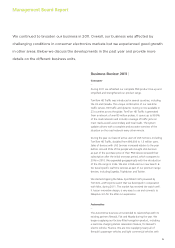
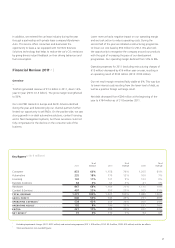
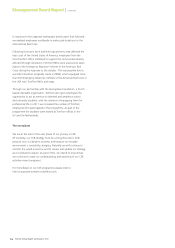
Taxation
—
Excluding the tax effect of the impairment and restructuring
charges, the income tax charge for the year was €13 million
compared to €27 million in 2010. The effective tax rate for 2011
was 15.0% as compared to 19.8% last year. The decrease in
group effective tax rate is mainly due to utilisation of losses not
previously capitalised and prior period adjustments, following the
completion of tax returns related to previous years in 2011.
Net result
—
The net result for the year was €73 million, down by €37 million
as compared to €110 million in 2010. The decrease was due
to the lower revenue, which was partly compensated by lower
operating and interest expenses as well as positive foreign
exchange results.
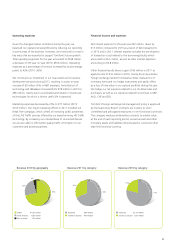
Liquidity and capital resources
—
During 2011 we generated €195 million in cash from operations
as compared to €265 million in 2010. The decrease was mainly
driven by lower operating results offset by lower investments in
working capital.
We invested €58 million in intangible assets during 2011 as part
of our commitment to continuous innovation mainly in technology
and database development projects. Moreover, we also invested
in property, plant and equipment, and on buying out some local
map making partners which gave TomTom full control of map
operations in certain additional geographical markets.
With regard to debt fi nancing, we repaid €210 million of
outstanding borrowings during 2011 in line with our debt
repayment schedule.
Management Board Report | continued
700
600
500
400
300
200
100
200920102011
01111131388
189
189
197
197202202
86
86
105
105
77
77
139
139
162
162
167
167
75
75
78
78
85
85
Research & development expenses
Amortisation of technology and databases
Marketing expenses
Selling, general and administrative expenses
Stock compensation
11138
189
197202
86
105
77
139
162
167
75
78
85
560
480
400
320
240
160
80
0
Cash position
31 December
2010
Operating
result
Depreciation
&
Amortisation
Working
capital
movement
Other
non-
cash
items
Interests,
taxes and
other
Investments Repayment
of
borrowings
Cash position
31 December
2011
306
87
119 – 13
2– 24 – 73
– 210
194
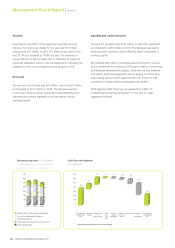
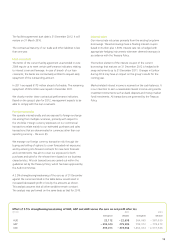
Operating expenses (€ in millions)
For comparative reasons we have excluded
impairment and restructuring expenses.
Cash fl ow development
(€ in millions)
1
1 Operating result adjusted for impairment charge.