TomTom 2011 Annual Report Download - page 11
Download and view the complete annual report
Please find page 11 of the 2011 TomTom annual report below. You can navigate through the pages in the report by either clicking on the pages listed below, or by using the keyword search tool below to find specific information within the annual report.-
 1
1 -
 2
2 -
 3
3 -
 4
4 -
 5
5 -
 6
6 -
 7
7 -
 8
8 -
 9
9 -
 10
10 -
 11
11 -
 12
12 -
 13
13 -
 14
14 -
 15
15 -
 16
16 -
 17
17 -
 18
18 -
 19
19 -
 20
20 -
 21
21 -
 22
22 -
23
-
24
-
25
-
26
-
27
-
28
-
29
-
30
-
31
-
32
-
33
-
34
-
35
-
36
-
37
-
38
-
39
-
40
-
41
-
42
-
43
-
44
-
45
-
46
-
47
-
48
-
49
-
50
-
51
-
52
-
53
-
54
-
55
-
56
-
57
-
58
-
59
-
60
-
61
-
62
-
63
-
64
-
65
-
66
-
67
-
68
-
69
-
70
-
71
-
72
-
73
-
74
-
75
-
76
-
77
-
78
-
79
-
80
-
81
-
82
-
83
-
84
-
85
-
86
-
87
-
88
 |
 |
9
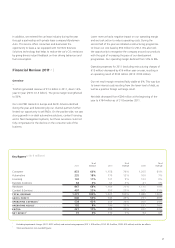
Operating expenses
—
Given the changed market conditions during the year, we
balanced our operational expenditures by reducing our spending
in some areas of the business. However, we continued to invest in
key areas that are essential to support TomTom’s future growth.
Total operating expenses for the year amounted to €538 million,
a decrease of 3% year-on-year (2010: €554 million). Operating
expenses as a percentage of revenue increased by six percentage
points to 42% (2010: 36%).
We continued our investment in our map assets and innovative
development projects during 2011, resulting in a year-on-year
increase of €5 million (3%) in R&D expenses. Amortisation of
technology and databases increased from €78 million in 2010 to
€85 million, mainly due to accelerated amortisation of particular
technologies for which a shorter useful life is expected.
Marketing expenses decreased by 27% to €77 million (2010:
€105million). Our major marketing efforts in 2011 included our
Break Free campaign, which aimed at increasing public awareness
of the LIVE Traffi c services offered by our award-winning HD Traffi c
technology. By increasing our installed base of connected devices
we are also able to offer better quality traffi c information to our
customers and business partners.
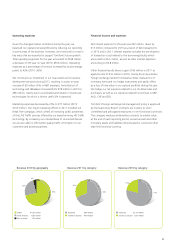
Financial income and expenses
—
Net interest expense for the year was €22 million, down by
€13 million compared to 2010 as a result of debt repayments
in 2010 and in 2011. Interest expense includes the amortisation
of transaction costs related to the borrowings facility which
amounted to €6.3 million, as well as other interest expenses
amounting to €0.8 million.
Other fi nancial results shows a gain of €6 million in 2011 as
against a loss of €16 million in 2010, mainly driven by positive
foreign exchange results from balance sheet revaluations of
monetary items and our hedge instruments and partly offset
by a loss of time value in our options portfolio during the year.
We hedge our net exposure related to our US dollar sales and
purchases, as well as our exposure related to revenues in GBP,
AUD, CHF and SEK.
TomTom’s foreign exchange risk management policy is approved
by the Supervisory Board. Contracts are in place to cover
committed and anticipated exposures in non-functional currencies.
The company revalues all derivative contracts to market value
at the end of each reporting period, as well as cash and other
monetary assets and liabilities denominated in currencies other
than the functional currency.
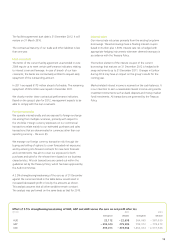
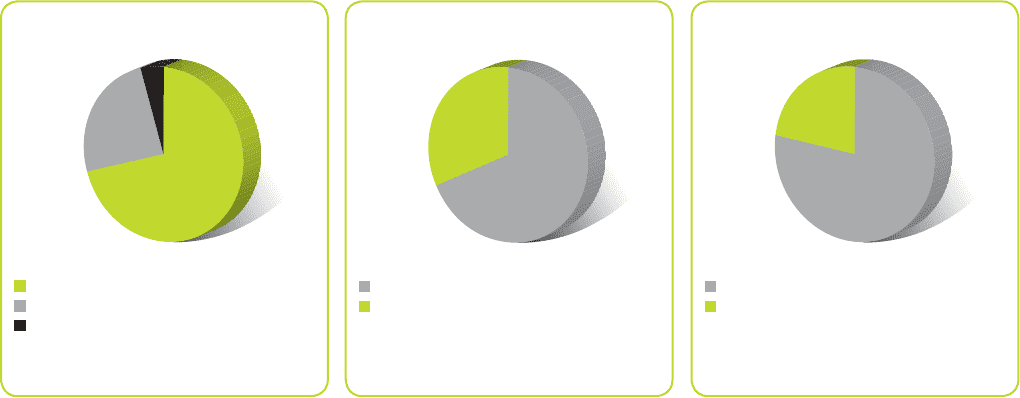
70%
5%
25%
EMEA €1,070 million
North America €380 million
Rest of world €70 million
Revenue 2010 by geography
68%
32%
Hardware €867 million
Content & Services €407 million
77%
23%
Hardware €1,164 million
Content & Services €357 million
Revenue 2011 by category Revenue 2010 by category