TomTom 2011 Annual Report Download - page 10
Download and view the complete annual report
Please find page 10 of the 2011 TomTom annual report below. You can navigate through the pages in the report by either clicking on the pages listed below, or by using the keyword search tool below to find specific information within the annual report.-
 1
1 -
 2
2 -
 3
3 -
 4
4 -
 5
5 -
 6
6 -
 7
7 -
 8
8 -
 9
9 -
 10
10 -
 11
11 -
 12
12 -
 13
13 -
 14
14 -
 15
15 -
 16
16 -
 17
17 -
 18
18 -
 19
19 -
 20
20 -
 21
21 -
22
-
23
-
24
-
25
-
26
-
27
-
28
-
29
-
30
-
31
-
32
-
33
-
34
-
35
-
36
-
37
-
38
-
39
-
40
-
41
-
42
-
43
-
44
-
45
-
46
-
47
-
48
-
49
-
50
-
51
-
52
-
53
-
54
-
55
-
56
-
57
-
58
-
59
-
60
-
61
-
62
-
63
-
64
-
65
-
66
-
67
-
68
-
69
-
70
-
71
-
72
-
73
-
74
-
75
-
76
-
77
-
78
-
79
-
80
-
81
-
82
-
83
-
84
-
85
-
86
-
87
-
88
 |
 |
TomTom Annual Report and Accounts 2011
8
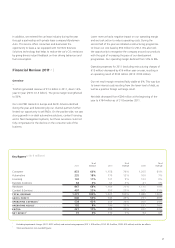
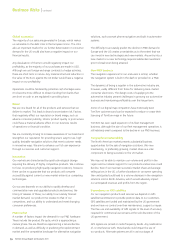
Revenue
—
Consumer revenue decreased year-on-year by €325 million to
€833 million, mainly due to lower PND sales; this was partly offset
by growth in content and services revenue. The growth in content
and services revenue in Consumer came mainly from LIVE Services
subscriptions revenue, but mobile and maps also performed well.
Consumer revenue included the fi rst contributions from the new
sports watch which was developed in partnership with Nike.
Automotive revenue grew strongly both in systems sales and map
sales to €235 million, an increase of 31% year-on-year (2010:
€179 million). In total Automotive sold 800,000 in-dash units in
2011, up from 584,000 in 2010.
Licensing delivered a growth in revenue, and grew 9% to
€142 million (2010: €131 million). The growth came from strong
revenue in the internet and wireless segment.
Business Solutions continues to achieve strong organic growth
in the number of WEBFLEET subscribers. Year-on-year, revenue
increased by €11 million (20%) to €64 million from €53 million.
The number of WEBFLEET subscriptions increased by 34% to
180,000.
Content & Services revenue increased from €357 million in 2010
to €407 million in 2011, and currently accounts for 32% of
group revenue (2010: €23%). The growth in Content & Services
was mainly driven by strong growth in Consumer’s LIVE Services
subscriptions revenue, increased revenue in WEBFLEET Business
Solutions, and growth in map licensing revenue.
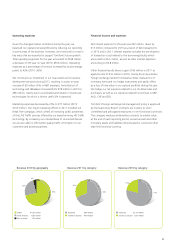
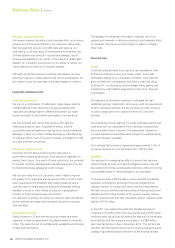
Revenue by geography
From a geographical perspective, the EMEA region contributed
74% of group revenue (2010: 70%) while North America and Rest
of World (mainly Asia Pacifi c) accounted for 20% (2010: 25%) and
6% (2010: 5%) respectively. Compared to 2010, revenue in the
EMEA region and North America decreased by €133 million and
€124 million respectively. Revenue in the Rest of World increased
by €9 million. During the year we launched our PNDs in the Indian
and South East Asian markets and expanded the availability of our
HD traffi c products.
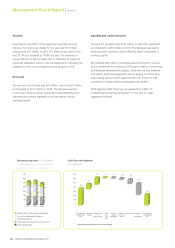
Gross profi t
Gross profi t decreased by 14% from €744 million in 2010
to €640 million 2011, due to the decline in revenue. Gross
margin increased by one percentage point year-on-year to
50% (2010: 49%), mainly because of the higher proportion of
Content & Services revenue in the overall revenue mix.
Management Board Report | continued
5%
11% 66%
18%
Consumer €833 million
Automotive €235 million
Licensing €142 million
Business Solutions €64 million
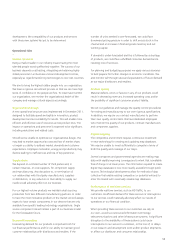
3%
12%
76%
9%
Consumer €1,158 million
Automotive €179 million
Licensing €131million
Business Solutions €53 million
Revenue 2011 by business unit Revenue 2010 by business unit
74%
20%
6%
EMEA €937 million
North America €257 million
Rest of world €79 million
Revenue 2011 by geography