TomTom 2011 Annual Report Download - page 77
Download and view the complete annual report
Please find page 77 of the 2011 TomTom annual report below. You can navigate through the pages in the report by either clicking on the pages listed below, or by using the keyword search tool below to find specific information within the annual report.-
 1
1 -
2
-
3
-
4
-
5
-
6
-
7
-
8
-
9
-
10
-
11
-
12
-
13
-
14
-
15
-
16
-
17
-
18
-
19
-
20
-
21
-
22
-
23
-
24
-
25
-
26
-
27
-
28
-
29
-
30
-
31
-
32
-
33
-
34
-
35
-
36
-
37
-
38
-
39
-
40
-
41
-
42
-
43
-
44
-
45
-
46
-
47
-
48
-
49
-
50
-
51
-
52
-
53
-
54
-
55
-
56
-
57
-
58
-
59
-
60
-
61
-
62
-
63
-
64
-
65
-
66
-
 67
67 -
 68
68 -
 69
69 -
 70
70 -
 71
71 -
 72
72 -
 73
73 -
 74
74 -
 75
75 -
 76
76 -
 77
77 -
 78
78 -
 79
79 -
 80
80 -
 81
81 -
 82
82 -
 83
83 -
 84
84 -
 85
85 -
 86
86 -
 87
87 -
88
 |
 |

75
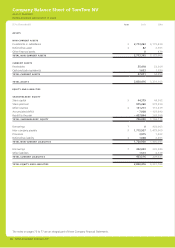
1. PRESENTATION OF FINANCIAL STATEMENTS AND RECOGNITION AND MEASUREMENT PRINCIPLES
The description of the activities of TomTom NV (the ‘company’) and the company structure, as included in the notes to the consolidated
fi nancial statements, also apply to the company fi nancial statements.
The company has prepared its company fi nancial statements in accordance with Part 9 of Book 2 of the Netherlands Civil Code, and
specifi cally, in accordance with section 362.8 of the Code. In doing so it has applied the principles of recognition and measurement
as adopted in the consolidated fi nancial statements (IFRS). Investments in subsidiaries are accounted for using the equity method. For more
information on the accounting policies applied, and on the notes to the consolidated fi nancial statements, please refer to page 45 to 72.
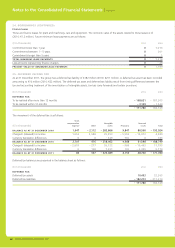
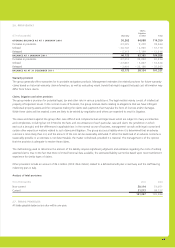
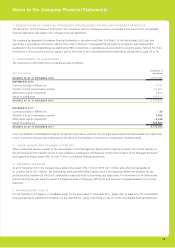
2. INVESTMENTS IN SUBSIDIARIES
The movements in the Investments in subsidiaries were as follows:
(€ in thousands)
Investments in
subsidiaries
BALANCE AS AT 31 DECEMBER 2009 3,019,488
MOVEMENTS 2010
Currency translation differences 1,071
Transfer to stock compensation reserve 12,361
Other direct equity movements 2,654
Result of subsidiaries 138,255
BALANCE AS AT 31 DECEMBER 2010 3,173,829
MOVEMENTS 2011
Currency translation differences – 25
Transfer to stock compensation reserve 7,562
Other direct equity movements – 4,438
Result of subsidiaries – 403,665
BALANCE AS AT 31 DECEMBER 2011 2,773,263
A list of subsidiaries and affi liated companies prepared in accordance with the relevant legal requirements (the Netherlands Civil Code Book
2, Part 9, Sections 379 and 414) is deposited at the offi ce of the Chamber of Commerce in Amsterdam, the Netherlands.
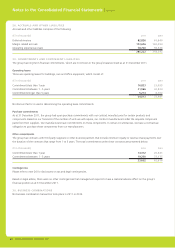
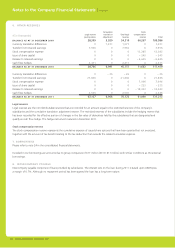
3. OTHER INCOME AND EXPENSES AFTER TAX
Other income and expense consists of the remuneration of the Management Board and the Supervisory Board, the interest expense on
the borrowings and the interest income on the company’s outstanding cash balances. For the remuneration of the Management Board
and Supervisory Board, please refer to note 7 of the consolidated fi nancial statements.
4. DEFERRED TAXATION
As at 31 December 2011, the company has a deferred tax asset of €0.1 million (2010: €2.7 million) and a deferred tax liability of
€1.0 million (2010: €2.7 million). The deferred tax asset and deferred tax liability result from temporary differences between the tax
and accounting treatment of the stock compensation expenses and the borrowing cost respectively. The movement of the deferred tax
positions during the year were the result of changes/reversals of temporary differences and have been charged/released to the income
statement.
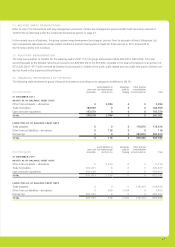
5. SHAREHOLDERS’ EQUITY
For the statement of changes in consolidated equity for the year ended 31 December 2011, please refer to page 44 in the consolidated
fi nancial statements. Additional information on the shareholders’ equity is disclosed in note 21 in the consolidated fi nancial statements.
Notes to the Company Financial Statements