TomTom 2011 Annual Report Download - page 62
Download and view the complete annual report
Please find page 62 of the 2011 TomTom annual report below. You can navigate through the pages in the report by either clicking on the pages listed below, or by using the keyword search tool below to find specific information within the annual report.-
 1
1 -
2
-
3
-
4
-
5
-
6
-
7
-
8
-
9
-
10
-
11
-
12
-
13
-
14
-
15
-
16
-
17
-
18
-
19
-
20
-
21
-
22
-
23
-
24
-
25
-
26
-
27
-
28
-
29
-
30
-
31
-
32
-
33
-
34
-
35
-
36
-
37
-
38
-
39
-
40
-
41
-
42
-
43
-
44
-
45
-
46
-
47
-
48
-
49
-
50
-
51
-
 52
52 -
 53
53 -
 54
54 -
 55
55 -
 56
56 -
 57
57 -
 58
58 -
 59
59 -
 60
60 -
 61
61 -
 62
62 -
 63
63 -
 64
64 -
 65
65 -
 66
66 -
 67
67 -
 68
68 -
 69
69 -
 70
70 -
 71
71 -
 72
72 -
73
-
74
-
75
-
76
-
77
-
78
-
79
-
80
-
81
-
82
-
83
-
84
-
85
-
86
-
87
-
88
 |
 |

TomTom Annual Report and Accounts 2011
60
Notes to the Consolidated Financial Statements | continued
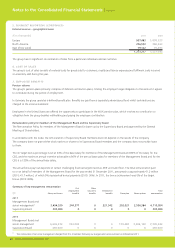
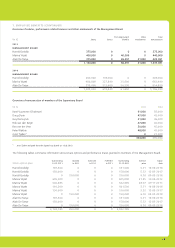
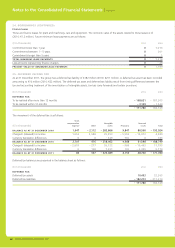
13. INTANGIBLE ASSETS (CONTINUED)
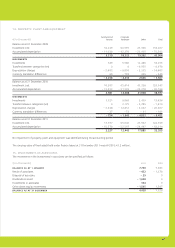
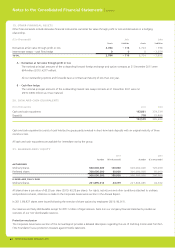
The following table sets out a segment-level summary of the goodwill for our segments before and after the impairment charge in 2011.
(€ in thousands) Consumer Automotive Licensing
Business
Solutions Total
BALANCE AS AT 31 DECEMBER 2010 641,831 83,389 85,217 44,276 854,713
2011 impairment – 473,144 0 0 0 – 473,144
BALANCE AS AT 31 DECEMBER 2011 168,687 83,389 85,217 44,276 381,569
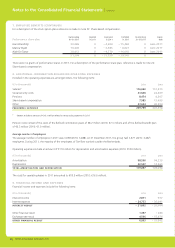
The recoverable amount of a CGU is determined based on the higher of the value in use or fair value less cost to sell calculations.
The fair value less cost to sell resulted in a higher recoverable amount.
The calculations of fair value less cost to sell use post-tax cash fl ow projections based on fi nancial forecasts approved by management
covering a three year period and extrapolated for another fi ve year period. Management considered the effects of applying a pre-tax
approach and concluded that this will not materially change the outcome of the impairment test. Cash fl ows beyond the three-year period
are extrapolated using the estimated growth rates.
Management’s cash fl ow projections for each of the segments in the forecasted and extrapolated period are based on management’s
assumptions on the expected revenue growth rate, gross margin and operating margin after allocation of operating expenses from shared
units, taking into account management’s expectation of market size and market share development.
The expected revenue growth rate incorporates the high level of decline in the PND revenue but also the growth potential of other revenue
streams within Consumer and other segments. Gross margin and operating margin projections were aligned with the expected revenue
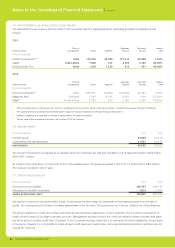
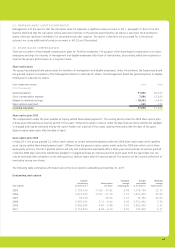
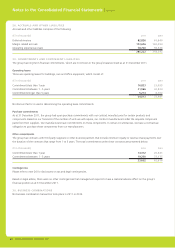
developments. Key assumptions after the forecasted and extrapolated period as well as the discount rate used for each of the segments are
presented below:
2011
(€ in thousands) Consumer Automotive Licensing
Business
Solutions
Revenue – perpetual growth1– 1.0% 1.0% 0% 1.0%
Operating expenses – perpetual growth1– 1.0% 1.0% 0% 1.0%
Discount rate210.0% 10.0% 10.0% 9.5%
2010
(€ in thousands) Consumer Automotive Licensing
Business
Solutions
Revenue – perpetual growth10.5% 1.8% 1.0% 1.0%
Operating expenses – perpetual growth10.5% 1.8% 1.0% 1.0%
Discount rate210.0% 10.0% 10.0% 9.5%
1 Weighted average growth rate used to extrapolate cash fl ows beyond the forecast and extrapolated period.
2 Post-tax discount rate applied to the cash fl ow projections.
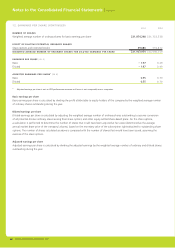
Discount rates used are post-tax and refl ect specifi c risks relating to the relevant operating segments. Insofar possible, our expectations and
input to the impairment calculation have been compared with the available external information from various analysts.
Management performed a sensitivity analysis on the relevant key assumptions in our 2011 year-end annual impairment testing. The outcome
of this sensitivity analysis showed that when the revenue growth rates as used in the three year forecasted period and the fi ve year
extrapolated period for the Consumer segment decreased by 1.8% in each year (ceteris paribus), the fair value less costs to sell would fall to
the level of the carrying value as at the end of 2011, leaving nil headroom.
The results of the sensitivity analysis of Automotive, Licensing and Business Solutions indicated that a reasonably possible change in the
above-mentioned key assumptions would not cause their fair value less costs to sell to fall below the level of the carrying value.