TomTom 2011 Annual Report Download - page 64
Download and view the complete annual report
Please find page 64 of the 2011 TomTom annual report below. You can navigate through the pages in the report by either clicking on the pages listed below, or by using the keyword search tool below to find specific information within the annual report.-
 1
1 -
2
-
3
-
4
-
5
-
6
-
7
-
8
-
9
-
10
-
11
-
12
-
13
-
14
-
15
-
16
-
17
-
18
-
19
-
20
-
21
-
22
-
23
-
24
-
25
-
26
-
27
-
28
-
29
-
30
-
31
-
32
-
33
-
34
-
35
-
36
-
37
-
38
-
39
-
40
-
41
-
42
-
43
-
44
-
45
-
46
-
47
-
48
-
49
-
50
-
51
-
52
-
53
-
 54
54 -
 55
55 -
 56
56 -
 57
57 -
 58
58 -
 59
59 -
 60
60 -
 61
61 -
 62
62 -
 63
63 -
 64
64 -
 65
65 -
 66
66 -
 67
67 -
 68
68 -
 69
69 -
 70
70 -
 71
71 -
 72
72 -
 73
73 -
 74
74 -
75
-
76
-
77
-
78
-
79
-
80
-
81
-
82
-
83
-
84
-
85
-
86
-
87
-
88
 |
 |

TomTom Annual Report and Accounts 2011
62
Notes to the Consolidated Financial Statements | continued
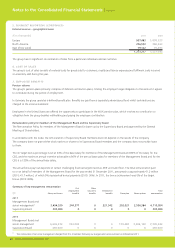
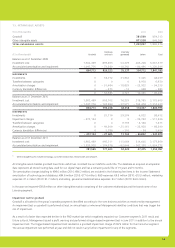
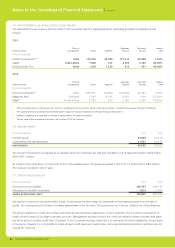
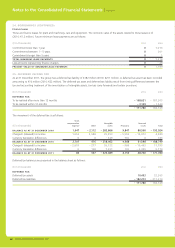
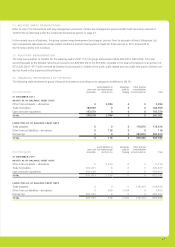
15. INVESTMENTS IN ASSOCIATES (CONTINUED)
The estimated full year revenues and net profi ts of the associates and their aggregated assets (excluding goodwill) and liabilities are as
follows:
2011
Name associate
Place of
incorporation Assets Liabilities
Revenues
full year
Net result
full year
Interest
held
(€ in thousands)
Infotech enterprises1, 2, 3 India 115,316 34,780 171,411 40,438 1.35%
MapIT1South Africa 7,546 272 4,552 2,102 49.00%
Beijing Golden Tom China 1,234 1,229 813 – 391 49.00%
2010
Name associate
Place of
incorporation Assets Liabilities
Revenues
full year
Net result
full year
Interest
held
(€ in thousands)
Infotech enterprises1, 2 India 189,541 36,806 150,086 25,091 1.35%
Mappoint Asia1Thailand 5,947 6,145 4,325 – 416 27.70%
MapIT1South Africa 7,741 336 5,176 2,498 49.00%
1 These associates have a 31 March year-end. Data for calculating the result associate, based on the equity method, is obtained from January through to December.
The summarised fi nancial information presented above is based on fi nancial statements for the year ending 31 March 2011.
2 Infotech is regarded as an associate as TomTom is represented in the Supervisory Board.
3 The fair value of the investment in Infotech is €2.4 million (2010: €4.3 million).
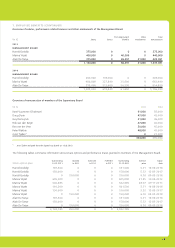
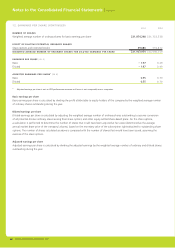
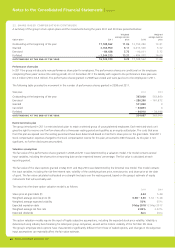
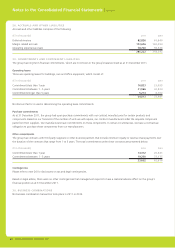
16. INVENTORIES
(€ in thousands) 2011 2010
Finished goods 33,969 63,431
Components and sub-assemblies 31,533 30,391
INVENTORIES 65,502 93,822
The amount of inventories recognised as an expense when the inventories are sold and included in cost of sales amounted to €432 million
(2010: €511 million).
As a result of the write-down of inventories to their net realisable value, the group recognised a cost of €11.2 million (2010: €8.9 million).
The costs are included in cost of sales.
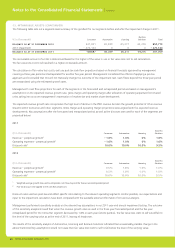
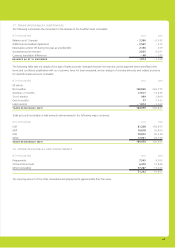
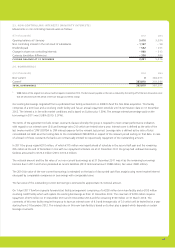
17. TRADE RECEIVABLES
(€ in thousands) 2011 2010
Gross accounts receivables 186,753 309,181
Allowance for doubtful receivables – 1,814 – 3,360
TRADE RECEIVABLES (NET) 184,939 305,821
We expect to recover all receivables within a year. An allowance has been made for estimated unrecoverable amounts from the sale of
goods. The carrying amount of trade receivables approximates their fair value. The group does not hold any collateral over these balances.
The group’s exposure to credit risk is infl uenced mainly by the individual characteristics of each customer. There is some concentration of
credit risk with certain of our large customers accounts. Management actively monitors the credit risk related to these customers and takes
pro-active action to reduce credit limits if required. In our Consumer business, credit risk is to some extent further mitigated by the purchase
of insurance, however it is not possible to insure all open credit exposures. Automotive, Licencing and Business Solutions customers are not
insured for credit risk.