TomTom 2011 Annual Report Download - page 55
Download and view the complete annual report
Please find page 55 of the 2011 TomTom annual report below. You can navigate through the pages in the report by either clicking on the pages listed below, or by using the keyword search tool below to find specific information within the annual report.-
 1
1 -
2
-
3
-
4
-
5
-
6
-
7
-
8
-
9
-
10
-
11
-
12
-
13
-
14
-
15
-
16
-
17
-
18
-
19
-
20
-
21
-
22
-
23
-
24
-
25
-
26
-
27
-
28
-
29
-
30
-
31
-
32
-
33
-
34
-
35
-
36
-
37
-
38
-
39
-
40
-
41
-
42
-
43
-
44
-
 45
45 -
 46
46 -
 47
47 -
 48
48 -
 49
49 -
 50
50 -
 51
51 -
 52
52 -
 53
53 -
 54
54 -
 55
55 -
 56
56 -
 57
57 -
 58
58 -
 59
59 -
 60
60 -
 61
61 -
 62
62 -
 63
63 -
 64
64 -
 65
65 -
66
-
67
-
68
-
69
-
70
-
71
-
72
-
73
-
74
-
75
-
76
-
77
-
78
-
79
-
80
-
81
-
82
-
83
-
84
-
85
-
86
-
87
-
88
 |
 |

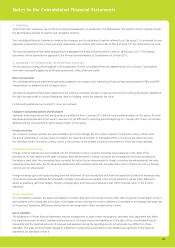
53
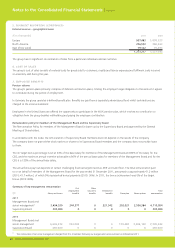
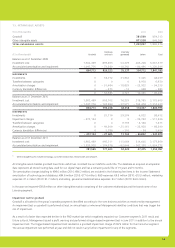
5. SEGMENT REPORTING
The operating segments are identifi ed and reported on the basis of internal reports about components of the group that are regularly
reviewed by the Management Board to assess the performance of the segments.
Internal management reporting is based upon four main segments (Consumer, Automotive, Licensing and Business Solutions), which are
our operating segments.
Management assesses the performance of segments based on the measures of revenue and earnings before interest and taxes (EBIT),
whereby the EBIT measure includes allocations of expenses from supporting functions within the group. Such allocations have been
determined based on relevant measures that refl ect the level of benefi ts of these functions to each of the operating segments. The effects
of non-recurring items such as impairment are excluded from management’s measurement basis. Interest income and expenses and tax are
not allocated to the segments. There is no measure of segment (non-current) assets provided to chief operating decision-maker.
The segment reporting in the fi nancial statements refl ects further refi nements in the allocation of expenses of supporting functions as
adopted in the internal management report. Accordingly the comparative information for 2010 has been adjusted to refl ect this change
and is therefore not necessarily comparable with the previously reported segment information.
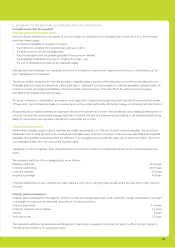
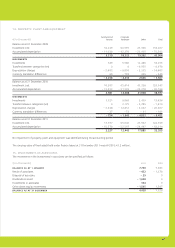
(€ in thousands) 2011 2010
REVENUE
Consumer 832,714 1,158,002
Automotive 234,755 179,470
Licensing 142,188 130,767
Business Solutions 63,560 52,844
TOTAL 1,273,217 1,521,083
EBIT
Consumer 70,730 196,688
Automotive 2,347 – 12,344
Licensing 26,250 5,138
Business Solutions 15,243 12,403
TOTAL 114,570 201,885
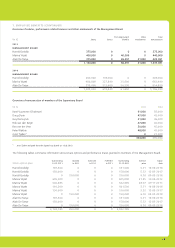
A reconciliation of the segments performance measure (EBIT) to the group’s result before tax is provided below.
(€ in thousands) 2011 2010
TOTAL SEGMENTS EBIT 114,570 201,885
Unallocated expenses1– 27,303 – 15,563
Impairment charge – 511,936 0
Interest result – 21,862 – 35,064
Other fi nance result 6,093 – 15,962
Result of associates – 432 – 1,270
RESULT BEFORE TAX – 440,870 134,026
1 Unallocated expenses in 2011 include €14 million group-wide restructuring costs which are not allocated to the operating segments.
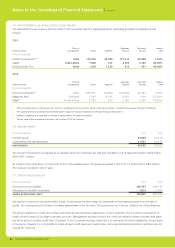
Revenue from external customers is derived primarily from the sale of portable navigation devices and in-dash navigation systems and
related content and services and the royalty income generated from licensing our map database.
A breakdown of the external revenue to types of products and services and to geographical areas is as follows:
External revenue – products and services
(€ in thousands) 2011 2010
Sale of goods 866,703 1,164,477
Rendering of services 191,541 162,882
Royalty revenue 214,973 193,724
1,273,217 1,521,083