Supercuts 2006 Annual Report Download - page 52
Download and view the complete annual report
Please find page 52 of the 2006 Supercuts annual report below. You can navigate through the pages in the report by either clicking on the pages listed below, or by using the keyword search tool below to find specific information within the annual report.-
 1
1 -
2
-
3
-
4
-
5
-
6
-
7
-
8
-
9
-
10
-
11
-
12
-
13
-
14
-
15
-
16
-
17
-
18
-
19
-
20
-
21
-
22
-
23
-
24
-
25
-
26
-
27
-
28
-
29
-
30
-
31
-
32
-
33
-
34
-
35
-
36
-
37
-
38
-
39
-
40
-
41
-
 42
42 -
 43
43 -
 44
44 -
 45
45 -
 46
46 -
 47
47 -
 48
48 -
 49
49 -
 50
50 -
 51
51 -
 52
52 -
 53
53 -
 54
54 -
 55
55 -
 56
56 -
 57
57 -
 58
58 -
 59
59 -
 60
60 -
 61
61 -
 62
62 -
63
-
64
-
65
-
66
-
67
-
68
-
69
-
70
-
71
-
72
-
73
-
74
-
75
-
76
-
77
-
78
-
79
-
80
-
81
-
82
-
83
-
84
-
85
-
86
-
87
-
88
-
89
-
90
-
91
-
92
-
93
-
94
-
95
-
96
-
97
-
98
-
99
-
100
-
101
-
102
-
103
-
104
-
105
-
106
-
107
-
108
-
109
-
110
-
111
-
112
-
113
-
114
-
115
-
116
-
117
-
118
-
119
-
120
-
121
-
122
-
123
-
124
-
125
-
126
 |
 |

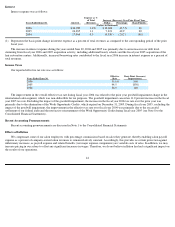
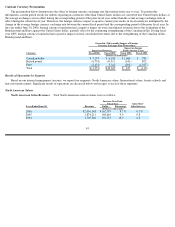
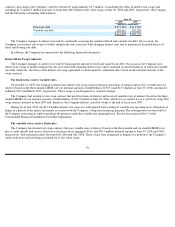
Acquisitions and organic growth were the primary drivers of the increase in total assets during fiscal year 2006. Acquisitions were
primarily funded by a combination of operating cash flows, debt and the assumption of acquired liabilities.
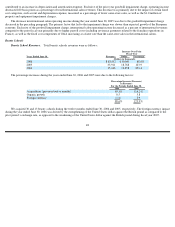
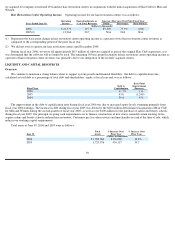
Total shareholders’ equity at June 30, 2006 and 2005 was as follows:
During fiscal year 2006 and 2005, equity increased as a result of net income, additional paid-in capital recorded in connection with the
exercise of stock options, and increased accumulated other comprehensive income due to foreign currency translation adjustments stemming
from the strengthening of foreign currencies that underlie our investments in those markets, partially offset by share repurchases under our
stock repurchase program. Additionally, the fiscal year 2005 increase in equity was also partially due to stock issued for business acquisitions.
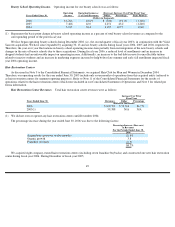
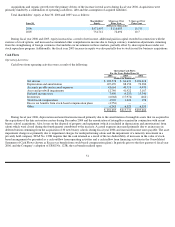
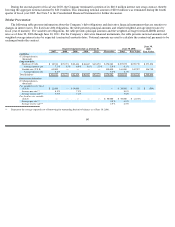
Cash Flows
Operating Activities
Cash flows from operating activities were a result of the following:
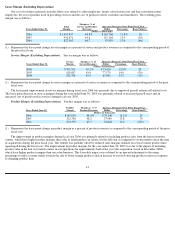
During fiscal year 2006, depreciation and amortization increased primarily due to the amortization of intangible assets that we acquired in
the acquisition of the hair restoration centers during December 2004 and the amortization of intangibles acquired in conjunction with recent
beauty school acquisitions. Also, losses on the disposal of property and equipment (which is included in depreciation and amortization) from
salons which were closed during the fourth quarter contributed to the increase. Accrued expenses increased primarily due to an increase in
deferred tuition stemming from the acquisition of 30 new beauty schools during fiscal year 2006 and increased income taxes payable. The asset
impairment charge was primarily due to impairment charges for underperforming salons and the impairment of a minority investment in a
privately held company. SFAS No. 123R requires that the cash retained as a result of the tax deductibility of increases in the value of stock-
based arrangements be presented as a cash outflow from operating activities and a cash inflow from financing activities in the Consolidated
Statement of Cash Flows (shown as Excess tax benefit from stock-based compensation plans). In periods prior to the first quarter of fiscal year
2006, and the Company’s adoption of SFAS No. 123R, the tax benefit realized upon
51
Shareholders
’
$
Increase Over
% Increase Over
June 30,
Equity
Prior Year
Prior Year
(Dollars in thousands)
2006
$
871,407
$
116,695
15.5
%
2005
754,712
72,692
10.7
Operating Cash Flows
For the Years Ended June 30,
2006
2005
2004
(Dollars in thousands)
Net income
$
109,578
$
64,631
$
104,218
Depreciation and amortization
107,470
88,150
72,380
Accounts payable and accrued expenses
43,664
40,714
4,470
Asset and goodwill impairments
12,740
41,922
3,167
Deferred income taxes
7,409
(9,257
)
15,340
Inventories
(6,068
)
(17,974
)
(462
)
Stock
-
based compensation
4,905
1,222
198
Excess tax benefits from stock
-
based compensation plans
(4,556
)
—
—
Other
6,543
6,323
6,353
$
281,685
$
215,731
$
205,664