Supercuts 2006 Annual Report Download - page 47
Download and view the complete annual report
Please find page 47 of the 2006 Supercuts annual report below. You can navigate through the pages in the report by either clicking on the pages listed below, or by using the keyword search tool below to find specific information within the annual report.-
 1
1 -
2
-
3
-
4
-
5
-
6
-
7
-
8
-
9
-
10
-
11
-
12
-
13
-
14
-
15
-
16
-
17
-
18
-
19
-
20
-
21
-
22
-
23
-
24
-
25
-
26
-
27
-
28
-
29
-
30
-
31
-
32
-
33
-
34
-
35
-
36
-
 37
37 -
 38
38 -
 39
39 -
 40
40 -
 41
41 -
 42
42 -
 43
43 -
 44
44 -
 45
45 -
 46
46 -
 47
47 -
 48
48 -
 49
49 -
 50
50 -
 51
51 -
 52
52 -
 53
53 -
 54
54 -
 55
55 -
 56
56 -
 57
57 -
58
-
59
-
60
-
61
-
62
-
63
-
64
-
65
-
66
-
67
-
68
-
69
-
70
-
71
-
72
-
73
-
74
-
75
-
76
-
77
-
78
-
79
-
80
-
81
-
82
-
83
-
84
-
85
-
86
-
87
-
88
-
89
-
90
-
91
-
92
-
93
-
94
-
95
-
96
-
97
-
98
-
99
-
100
-
101
-
102
-
103
-
104
-
105
-
106
-
107
-
108
-
109
-
110
-
111
-
112
-
113
-
114
-
115
-
116
-
117
-
118
-
119
-
120
-
121
-
122
-
123
-
124
-
125
-
126
 |
 |

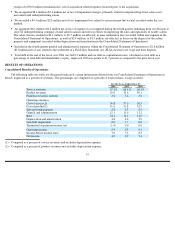
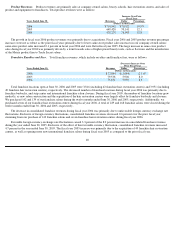
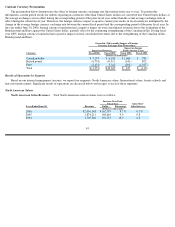
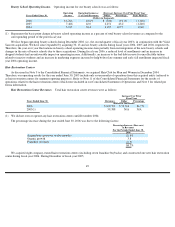
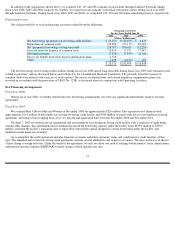
The percentage increases during the years ended June 30, 2006 and 2005 were due to the following factors:
We acquired 278 and 425 company-owned North American salons during the twelve months ended June 30, 2006 and 2005, respectively,
including 140 and 139 franchise buybacks. The organic growth stemmed primarily from the construction of 498 and 503 company-owned
salons in North America during the twelve months ended June 30, 2006 and 2005, respectively. The foreign currency impact during the years
ended June 30, 2006 and 2005 was driven by the weakening of the United States dollar against the Canadian dollar as compared to the prior
periods’ exchange rates.
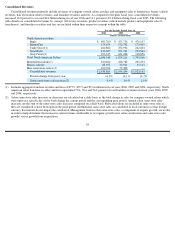
North American Salon Operating Income. Operating income for the North American salons was as follows:
(1)
Represents the basis point change in North American salon operating income as a percent of total North American salon revenues as
compared to the corresponding period of the prior fiscal year.
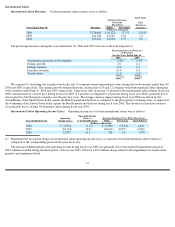
The decrease in North American salon operating income as a percentage of North American salon revenues during fiscal year 2006 was
primarily due to reduced retail product margins, largely the result of increased costs associated with the repackaging efforts by suppliers of
several top retail product lines. Additionally, rent and depreciation and amortization expenses increased as a percent of North American salon
revenues due to lease termination costs and losses on the disposal of property and equipment stemming from salon closures. During the fourth
quarter, we decided to close 64 company-owned salon locations prior to the lease end date in order to refocus efforts on improving the sales
and operations of nearby salons. Increased salon impairment charges during fiscal year 2006, and lower same-
store sales volumes during recent
fiscal years, also contributed to the increase in depreciation and amortization during fiscal year 2006.
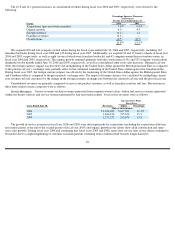
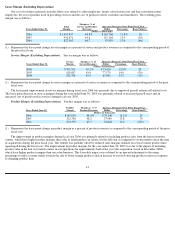
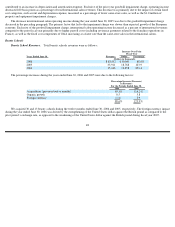
The decrease in North American salon operating income during the year ended June 30, 2005 was primarily related to decreased margins
stemming from lower vendor rebates due to a decrease in our level of purchases from certain vendors during fiscal year 2005, an upward
adjustment to the usage percentage to reflect current trends towards the sale of lower margin products and an increase to our slow-moving
product reserve in response to changing product lines. Additionally, an adjustment to the weighted average cost associated with our private
label product line negatively impacted our product margins in the North American salons. Additionally, rent increased at a faster rate than
North American salon same
-store sales during the year ended June 30, 2005 and payroll taxes were higher as a percent of North American
salon revenues than in the prior fiscal year.
46
Percentage Increase (Decrease)
in Revenues
For the Years Ended June 30,
2006
2005
Acquisitions (previous twelve months)
4.4
%
5.9
%
Organic growth
4.4
4.1
Foreign currency
0.4
0.4
Franchise revenues
(0.1
)
(0.1
)
Closed salons
(0.4
)
(0.4
)
8.7
%
9.9
%
Operating
Operating Income as
Increase (Decrease) Over Prior Fiscal Year
Years Ended June 30,
Income
% of Total Revenues
Dollar
Percentage
Basis Point(1)
(Dollars in thousands)
2006
$
256,561
12.6
%
$
8,481
3.4
%
(60
)
2005
248,080
13.2
(1,330
)
(0.5
)
(140
)
2004
249,410
14.6
20,935
9.2
(50
)