Supercuts 2006 Annual Report Download - page 39
Download and view the complete annual report
Please find page 39 of the 2006 Supercuts annual report below. You can navigate through the pages in the report by either clicking on the pages listed below, or by using the keyword search tool below to find specific information within the annual report.-
 1
1 -
2
-
3
-
4
-
5
-
6
-
7
-
8
-
9
-
10
-
11
-
12
-
13
-
14
-
15
-
16
-
17
-
18
-
19
-
20
-
21
-
22
-
23
-
24
-
25
-
26
-
27
-
28
-
 29
29 -
 30
30 -
 31
31 -
 32
32 -
 33
33 -
 34
34 -
 35
35 -
 36
36 -
 37
37 -
 38
38 -
 39
39 -
 40
40 -
 41
41 -
 42
42 -
 43
43 -
 44
44 -
 45
45 -
 46
46 -
 47
47 -
 48
48 -
 49
49 -
50
-
51
-
52
-
53
-
54
-
55
-
56
-
57
-
58
-
59
-
60
-
61
-
62
-
63
-
64
-
65
-
66
-
67
-
68
-
69
-
70
-
71
-
72
-
73
-
74
-
75
-
76
-
77
-
78
-
79
-
80
-
81
-
82
-
83
-
84
-
85
-
86
-
87
-
88
-
89
-
90
-
91
-
92
-
93
-
94
-
95
-
96
-
97
-
98
-
99
-
100
-
101
-
102
-
103
-
104
-
105
-
106
-
107
-
108
-
109
-
110
-
111
-
112
-
113
-
114
-
115
-
116
-
117
-
118
-
119
-
120
-
121
-
122
-
123
-
124
-
125
-
126
 |
 |

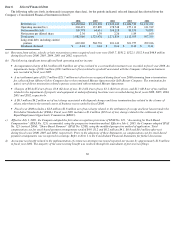
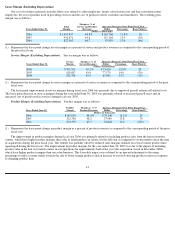
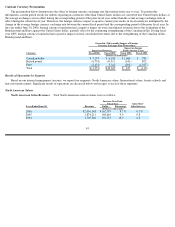
Consolidated Revenues
Consolidated revenues primarily include revenues of company-owned salons, product and equipment sales to franchisees, beauty schools
revenues, hair restoration center revenues, and franchise royalties and fees. As compared to the prior fiscal year, consolidated revenues
increased 10.8 percent to a record $2.4 billion during fiscal year 2006 and 14.1 percent to $2.2 billion during fiscal year 2005. The following
table details our consolidated revenues by concept. All service revenues, product revenues (which include product and equipment sales to
franchisees), and franchise royalties and fees are included within their respective concept within the table.
(1)
Includes aggregate franchise royalties and fees of $77.9, $79.5 and $73.6 million in fiscal years 2006, 2005 and 2004, respectively. North
American salon franchise royalties and fees represented 50.4, 50.6 and 56.2 percent of total franchise revenues in fiscal years 2006, 2005
and 2004, respectively.
(2)
Salon same-store sales increases or decreases are calculated on a daily basis as the total change in sales for company-owned salons which
were open on a specific day of the week during the current period and the corresponding prior period. Annual salon same-store sales
increases are the sum of the same-store sales increases computed on a daily basis. Relocated salons are included in same-store sales as
they are considered to have been open in the prior period. International same-store sales are calculated in local currencies so that foreign
currency fluctuations do not impact the calculation. Management believes that same-
store sales, a component of organic growth, are useful
in order to help determine the increase in salon revenues attributable to its organic growth (new salon construction and same-store sales
growth) versus growth from acquisitions.
38
For the Periods Ended June 30,
2006
2005
2004
(Dollars in thousands)
North American salons:
Regis
$
481,760
$
475,736
$
476,107
MasterCuts
174,674
172,792
173,415
Trade Secret(1)
262,862
252,934
242,604
SmartStyle
413,907
351,741
294,564
Strip Center(1)
703,345
621,008
518,856
Total North American Salons
2,036,548
1,874,211
1,705,546
International salons(1)
220,662
226,784
202,454
Beauty schools
63,952
33,911
15,143
Hair restoration centers(1)
109,702
59,388
—
Consolidated revenues
$
2,430,864
$
2,194,294
$
1,923,143
Percent change from prior year
10.8
%
14.1
%
14.2
%
Salon same
-
store sales increase(2)
0.4
%
0.9
%
2.6
%