Supercuts 2006 Annual Report Download - page 40
Download and view the complete annual report
Please find page 40 of the 2006 Supercuts annual report below. You can navigate through the pages in the report by either clicking on the pages listed below, or by using the keyword search tool below to find specific information within the annual report.-
 1
1 -
2
-
3
-
4
-
5
-
6
-
7
-
8
-
9
-
10
-
11
-
12
-
13
-
14
-
15
-
16
-
17
-
18
-
19
-
20
-
21
-
22
-
23
-
24
-
25
-
26
-
27
-
28
-
29
-
 30
30 -
 31
31 -
 32
32 -
 33
33 -
 34
34 -
 35
35 -
 36
36 -
 37
37 -
 38
38 -
 39
39 -
 40
40 -
 41
41 -
 42
42 -
 43
43 -
 44
44 -
 45
45 -
 46
46 -
 47
47 -
 48
48 -
 49
49 -
 50
50 -
51
-
52
-
53
-
54
-
55
-
56
-
57
-
58
-
59
-
60
-
61
-
62
-
63
-
64
-
65
-
66
-
67
-
68
-
69
-
70
-
71
-
72
-
73
-
74
-
75
-
76
-
77
-
78
-
79
-
80
-
81
-
82
-
83
-
84
-
85
-
86
-
87
-
88
-
89
-
90
-
91
-
92
-
93
-
94
-
95
-
96
-
97
-
98
-
99
-
100
-
101
-
102
-
103
-
104
-
105
-
106
-
107
-
108
-
109
-
110
-
111
-
112
-
113
-
114
-
115
-
116
-
117
-
118
-
119
-
120
-
121
-
122
-
123
-
124
-
125
-
126
 |
 |

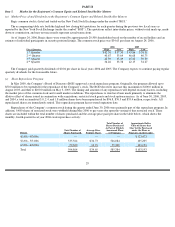
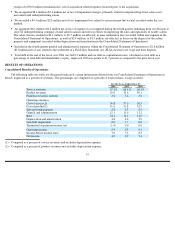
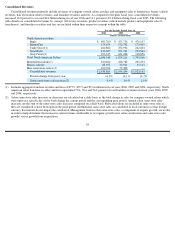
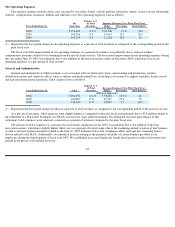
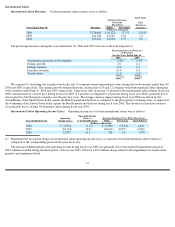
The 10.8 and 14.1 percent increases in consolidated revenues during fiscal year 2006 and 2005, respectively, were driven by the
following:
We acquired 290 and 444 company-owned salons during the fiscal years ended June 30, 2006 and 2005, respectively, including 142
franchise buybacks during fiscal year 2006 and 139 during fiscal year 2005. Additionally, we acquired 30 and 13 beauty schools in fiscal year
2006 and 2005, respectively, as well as eight (seven of which were franchise buybacks) and 42 company-owned hair restoration centers in
fiscal year 2006 and 2005, respectively. The organic growth stemmed primarily from the construction of 531 and 525 company-owned salons
during the twelve months ended June 30, 2006 and 2005, respectively, as well as consolidated same-store sales increases. During fiscal year
2006, the foreign currency impact was driven by the strengthening of the United States dollar against the British pound and Euro as compared
to the prior fiscal year’s exchange rates, partially offset by the continued weakening of the United States dollar against the Canadian dollar.
During fiscal year 2005, the foreign currency impact was driven by the weakening of the United States dollar against the British pound, Euro
and Canadian dollar as compared to the prior periods’ exchange rates. The impact of foreign currency was calculated by multiplying current
year revenues in local currencies by the change in the foreign currency exchange rate between the current fiscal year and the prior fiscal year.
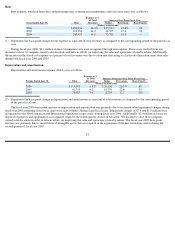
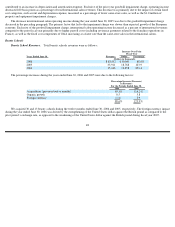
Consolidated revenues are primarily composed of service and product revenues, as well as franchise royalties and fees. Fluctuations in
these three major revenue categories were as follows:
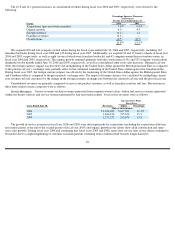
Service Revenues. Service revenues include revenues generated from company-owned salons, tuition and service revenues generated
within our beauty schools, and service revenues generated by hair restoration centers. Total service revenues were as follows:
The growth in service revenues in fiscal year 2006 and 2005 were driven primarily by acquisitions (including the acquisition of the hair
restoration centers at the end of the second quarter of fiscal year 2005) and organic growth in our salons (new salon construction and same-
store sales growth). During fiscal year 2004 and continuing into fiscal years 2005 and 2006, same-store service sales in our salons continued to
be modest due to a slight lengthening of customer visitation patterns stemming from a fashion trend towards longer hairstyles.
39
Percentage Increase (Decrease)
in Revenues
For the Years Ended June 30,
Factor
2006
2005
Acquisitions (previous twelve months)
7.5
%
9.4
%
Organic growth
4.0
4.3
Foreign currency
(0.1
)
1.1
Franchise revenues
(0.1
)
—
Closed salons
(0.5
)
(0.7
)
10.8
%
14.1
%
Increase Over Prior
Fiscal Year
Years Ended June 30,
Revenues
Dollar
Percentage
(Dollars in thousands)
2006
$
1,634,028
$
167,692
11.4
%
2005
1,466,336
195,104
15.3
2004
1,271,232
153,670
13.8