Supercuts 2006 Annual Report Download - page 43
Download and view the complete annual report
Please find page 43 of the 2006 Supercuts annual report below. You can navigate through the pages in the report by either clicking on the pages listed below, or by using the keyword search tool below to find specific information within the annual report.-
 1
1 -
2
-
3
-
4
-
5
-
6
-
7
-
8
-
9
-
10
-
11
-
12
-
13
-
14
-
15
-
16
-
17
-
18
-
19
-
20
-
21
-
22
-
23
-
24
-
25
-
26
-
27
-
28
-
29
-
30
-
31
-
32
-
 33
33 -
 34
34 -
 35
35 -
 36
36 -
 37
37 -
 38
38 -
 39
39 -
 40
40 -
 41
41 -
 42
42 -
 43
43 -
 44
44 -
 45
45 -
 46
46 -
 47
47 -
 48
48 -
 49
49 -
 50
50 -
 51
51 -
 52
52 -
 53
53 -
54
-
55
-
56
-
57
-
58
-
59
-
60
-
61
-
62
-
63
-
64
-
65
-
66
-
67
-
68
-
69
-
70
-
71
-
72
-
73
-
74
-
75
-
76
-
77
-
78
-
79
-
80
-
81
-
82
-
83
-
84
-
85
-
86
-
87
-
88
-
89
-
90
-
91
-
92
-
93
-
94
-
95
-
96
-
97
-
98
-
99
-
100
-
101
-
102
-
103
-
104
-
105
-
106
-
107
-
108
-
109
-
110
-
111
-
112
-
113
-
114
-
115
-
116
-
117
-
118
-
119
-
120
-
121
-
122
-
123
-
124
-
125
-
126
 |
 |
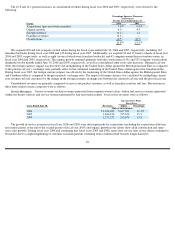
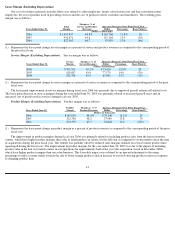
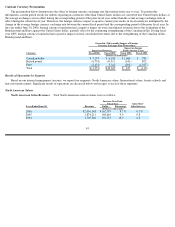
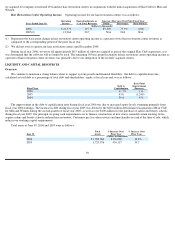
Site Operating Expenses
This expense category includes direct costs incurred by our salons, beauty schools and hair restoration centers, such as on-site advertising,
workers’ compensation, insurance, utilities and janitorial costs. Site operating expenses were as follows:
(1)
Represents the basis point change in site operating expenses as a percent of total revenues as compared to the corresponding period of the
prior fiscal year.
The fiscal year 2006 improvement in site operating expenses as a percent of revenues was primarily due to reduced workers’
compensation insurance-related costs stemming from decreased claims activity. The basis point improvement in site operating expenses during
the year ended June 30, 2005 was primarily due to the addition of the hair restoration centers in December 2004, which have lower site
operating expenses as a percentage of total revenue.
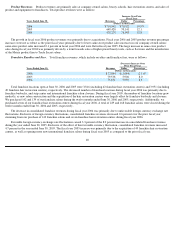
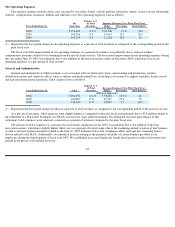
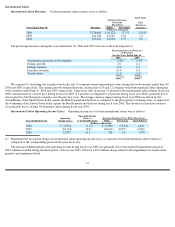
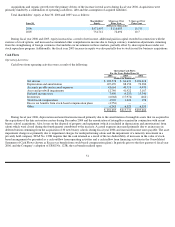
General and Administrative
General and administrative (G&A) includes costs associated with our field supervision, salon training and promotions, product
distribution centers and corporate offices (such as salaries and professional fees), including costs incurred to support franchise, beauty school
and hair restoration center operations. G&A expenses were as follows:
(1)
Represents the basis point change in G&A as a percent of total revenues as compared to the corresponding period of the prior fiscal year.
As a percent of revenues, G&A expenses were slightly higher as compared to the prior fiscal year primarily due to $2.8 million related to
the settlement of a Fair Labor Standards Act (FLSA) lawsuit over wage and hour disputes. Excluding the ten basis point impact of this
settlement, G&A expenses were relatively consistent as a percent of revenues compared to the prior fiscal year.
The increase in G&A expenses as a percent of total revenues during fiscal year 2005 was primarily due to the addition of the hair
restoration centers, which have slightly higher G&A costs as a percent of total revenues due to the marketing-intensive nature of that business,
as well as increased professional fees related to the June 30, 2005 Sarbanes-Oxley 404 compliance effort and legal fees stemming from a
lawsuit related to the FLSA. Additionally, we identified an issue relating to the potential taxability of certain benefits provided to our
employees during the fourth quarter of fiscal year 2005. We established an accrual during our fourth fiscal quarter to address this matter and
remain in the process of resolving this issue.
42
Expense as %
Site
of Total
Increase (Decrease) Over Prior Fiscal Year
Years Ended June 30,
Operating
Revenues
Dollar
Percentage
Basis Point(1)
(Dollars in thousands)
2006
$
199,602
8.2
%
$
16,546
9.0
%
(10
)
2005
183,056
8.3
19,691
12.1
(20
)
2004
163,365
8.5
21,192
14.9
10
Expense as %
of Total
Increase (Decrease) Over Prior Fiscal Year
Years Ended June 30,
G&A
Revenues
Dollar
Percentage
Basis Point(1)
(Dollars in thousands)
2006
$
294,092
12.1
%
$
33,885
13.0
%
20
2005
260,207
11.9
45,597
21.2
70
2004
214,610
11.2
19,047
9.7
(40
)