Salesforce.com 2015 Annual Report Download - page 93
Download and view the complete annual report
Please find page 93 of the 2015 Salesforce.com annual report below. You can navigate through the pages in the report by either clicking on the pages listed below, or by using the keyword search tool below to find specific information within the annual report.-
 1
1 -
2
-
3
-
4
-
5
-
6
-
7
-
8
-
9
-
10
-
11
-
12
-
13
-
14
-
15
-
16
-
17
-
18
-
19
-
20
-
21
-
22
-
23
-
24
-
25
-
26
-
27
-
28
-
29
-
30
-
31
-
32
-
33
-
34
-
35
-
36
-
37
-
38
-
39
-
40
-
41
-
42
-
43
-
44
-
45
-
46
-
47
-
48
-
49
-
50
-
51
-
52
-
53
-
54
-
55
-
56
-
57
-
58
-
59
-
60
-
61
-
62
-
63
-
64
-
65
-
66
-
67
-
68
-
69
-
70
-
71
-
72
-
73
-
74
-
75
-
76
-
77
-
78
-
79
-
80
-
81
-
82
-
 83
83 -
 84
84 -
 85
85 -
 86
86 -
 87
87 -
 88
88 -
 89
89 -
 90
90 -
 91
91 -
 92
92 -
 93
93 -
 94
94 -
 95
95 -
 96
96 -
 97
97 -
 98
98 -
 99
99 -
 100
100 -
 101
101 -
 102
102 -
 103
103 -
104
-
105
-
106
-
107
-
108
-
109
-
110
-
111
-
112
-
113
-
114
-
115
-
116
-
117
-
118
-
119
-
120
-
121
-
122
-
123
-
124
-
125
-
126
-
127
-
128
-
129
-
130
-
131
-
132
-
133
-
134
 |
 |

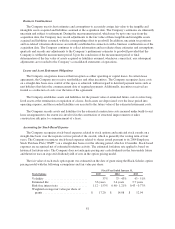
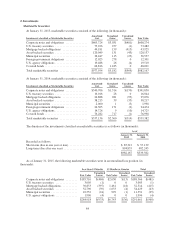
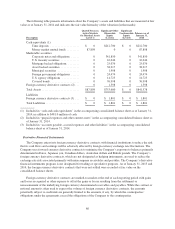
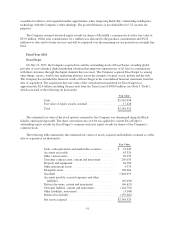
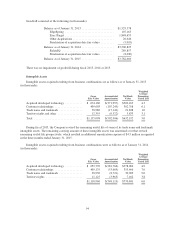
Details on outstanding foreign currency derivative contracts related primarily to intercompany receivables
and payables are presented below (in thousands):
As of January 31,
2015 2014
Notional amount of foreign currency derivative contracts ............ $942,086 $563,060
Fair value of foreign currency derivative contracts ................. $ 4,917 $ (203)
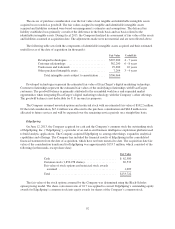
The fair value of the Company’s outstanding derivative instruments are summarized below (in thousands):
Fair Value of Derivative Instruments
As of January 31,
Balance Sheet Location 2015 2014
Derivative Assets
Derivatives not designated as hedging
instruments:
Foreign currency derivative
contracts .....................
Prepaid expenses and
other current assets $10,611 $1,598
Derivative Liabilities
Derivatives not designated as hedging
instruments:
Foreign currency derivative
contracts .....................
Accounts payable,
accrued expenses
and other liabilities $ 5,694 $1,801
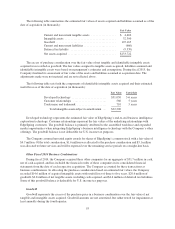
The effect of the derivative instruments not designated as hedging instruments on the consolidated
statements of operations during fiscal 2015, 2014 and 2013, respectively, are summarized below (in thousands):
Derivatives Not Designated as Hedging
Instruments
Gains (Losses) on Derivative Instruments
Recognized in Income
Fiscal Year Ended January 31,
Location 2015 2014 2013
Foreign currency derivative contracts ..... Other income (expense) $(1,186) $108 $16,591
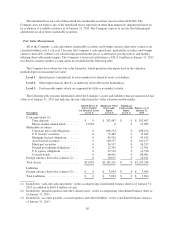
Strategic Investments
As of January 31, 2015, the Company has four investments in marketable equity securities measured using
quoted prices in their respective active markets and certain interests in non-marketable equity and debt securities
that are collectively considered strategic investments. As of January 31, 2015, the fair value of the Company’s
marketable equity securities of $17.8 million includes an unrealized gain of $13.1 million. As of January 31,
2014, the Company had three investments in marketable equity securities that had a fair value of $15.5 million,
which included an unrealized gain of $13.3 million. These investments are recorded at fair value in other assets,
net on the consolidated balance sheets.
The Company’s interest in non-marketable equity and debt securities consists of noncontrolling equity and
debt investments in privately-held companies. The Company’s investments in these privately-held companies are
reported at cost or marked down to fair value when an event or circumstance indicates an other-than-temporary
decline in value has occurred. These investments are valued using significant unobservable inputs or data in an
inactive market and the valuation requires the Company’s judgment due to the absence of market prices and
inherent lack of liquidity.
87