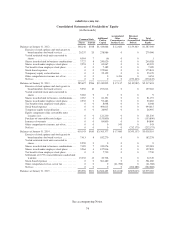
Salesforce.com 2015 Annual Report Download - page 81
Download and view the complete annual report
Please find page 81 of the 2015 Salesforce.com annual report below. You can navigate through the pages in the report by either clicking on the pages listed below, or by using the keyword search tool below to find specific information within the annual report.-
 1
1 -
2
-
3
-
4
-
5
-
6
-
7
-
8
-
9
-
10
-
11
-
12
-
13
-
14
-
15
-
16
-
17
-
18
-
19
-
20
-
21
-
22
-
23
-
24
-
25
-
26
-
27
-
28
-
29
-
30
-
31
-
32
-
33
-
34
-
35
-
36
-
37
-
38
-
39
-
40
-
41
-
42
-
43
-
44
-
45
-
46
-
47
-
48
-
49
-
50
-
51
-
52
-
53
-
54
-
55
-
56
-
57
-
58
-
59
-
60
-
61
-
62
-
63
-
64
-
65
-
66
-
67
-
68
-
69
-
70
-
 71
71 -
 72
72 -
 73
73 -
 74
74 -
 75
75 -
 76
76 -
 77
77 -
 78
78 -
 79
79 -
 80
80 -
 81
81 -
 82
82 -
 83
83 -
 84
84 -
 85
85 -
 86
86 -
 87
87 -
 88
88 -
 89
89 -
 90
90 -
 91
91 -
92
-
93
-
94
-
95
-
96
-
97
-
98
-
99
-
100
-
101
-
102
-
103
-
104
-
105
-
106
-
107
-
108
-
109
-
110
-
111
-
112
-
113
-
114
-
115
-
116
-
117
-
118
-
119
-
120
-
121
-
122
-
123
-
124
-
125
-
126
-
127
-
128
-
129
-
130
-
131
-
132
-
133
-
134
 |
 |

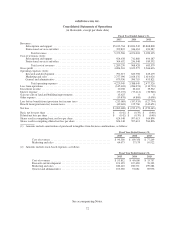
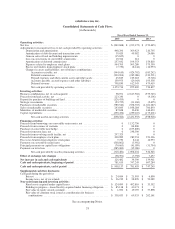
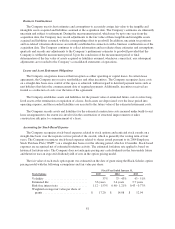
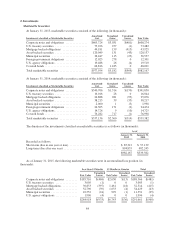
salesforce.com, inc.
Consolidated Statements of Cash Flows
(in thousands)
Fiscal Year Ended January 31,
2015 2014 2013
Operating activities:
Net loss ........................................................... $ (262,688) $ (232,175) $ (270,445)
Adjustments to reconcile net loss to net cash provided by operating activities:
Depreciation and amortization ...................................... 448,296 369,423 216,795
Amortization of debt discount and transaction costs ..................... 39,620 49,582 24,086
Gain on sales of land and building improvements ...................... (15,625) 0 0
Loss on conversions of convertible senior notes ........................ 10,326 214 0
Amortization of deferred commissions ............................... 257,642 194,553 154,818
Expenses related to employee stock plans ............................. 564,765 503,280 379,350
Excess tax benefits from employee stock plans ........................ (7,730) (8,144) (14,933)
Changes in assets and liabilities, net of business combinations:
Accounts receivable, net ...................................... (544,610) (424,702) (183,242)
Deferred commissions ........................................ (320,904) (265,080) (232,591)
Prepaid expenses and other current assets and other assets ............ 45,819 105,218 (9,718)
Accounts payable, accrued expenses and other liabilities ............. 159,973 (29,043) 193,358
Deferred revenue ............................................ 798,830 612,343 479,419
Net cash provided by operating activities ......................... 1,173,714 875,469 736,897
Investing activities:
Business combinations, net of cash acquired .............................. 38,071 (2,617,302) (579,745)
Proceeds from land activity, net ........................................ 223,240 0 (4,106)
Deposit for purchase of building and land ................................. (126,435) 0 0
Strategic investments ................................................. (93,725) (31,160) (9,695)
Purchases of marketable securities ...................................... (780,540) (558,703) (1,021,287)
Sales of marketable securities .......................................... 243,845 1,038,284 706,893
Maturities of marketable securities ...................................... 87,638 36,436 144,623
Capital expenditures ................................................. (290,454) (299,110) (175,601)
Net cash used in investing activities ............................. (698,360) (2,431,555) (938,918)
Financing activities:
Proceeds from borrowings on convertible senior notes, net ................... 0 1,132,750 0
Proceeds from issuance of warrants ..................................... 0 84,800 0
Purchase of convertible note hedge ...................................... 0 (153,800) 0
Proceeds from term loan, net ........................................... 0 298,500 0
Proceeds from revolving credit facility, net ............................... 297,325 0 0
Proceeds from employee stock plans ..................................... 308,989 289,931 351,366
Excess tax benefits from employee stock plans ............................ 7,730 8,144 14,933
Payments on convertible senior notes .................................... (568,862) (5,992) 0
Principal payments on capital lease obligations ............................ (70,663) (41,099) (31,754)
Payments on term loan ............................................... (285,000) (15,000) 0
Net cash provided by (used in) financing activities ................. (310,481) 1,598,234 334,545
Effect of exchange rate changes ....................................... (38,391) (7,758) 7,437
Net increase in cash and cash equivalents ............................... 126,482 34,390 139,961
Cash and cash equivalents, beginning of period .......................... 781,635 747,245 607,284
Cash and cash equivalents, end of period ............................... $ 908,117 $ 781,635 $ 747,245
Supplemental cash flow disclosure:
Cash paid during the period for:
Interest ........................................................ $ 24,684 $ 21,503 $ 6,890
Income taxes, net of tax refunds .................................... $ 36,219 $ 28,870 $ 53,089
Non-cash financing and investing activities:
Fixed assets acquired under capital leases ............................. $ 124,099 $ 492,810 $ 33,392
Building in progress—leased facility acquired under financing obligation . . . $ 85,118 $ 40,171 $ 0
Fair value of equity awards assumed ................................. $ 1,050 $ 19,037 $ 37,898
Fair value of common stock issued as consideration for business
combinations ................................................. $ 338,033 $ 69,533 $ 202,161
See accompanying Notes.
75