Salesforce.com 2015 Annual Report Download - page 54
Download and view the complete annual report
Please find page 54 of the 2015 Salesforce.com annual report below. You can navigate through the pages in the report by either clicking on the pages listed below, or by using the keyword search tool below to find specific information within the annual report.-
 1
1 -
2
-
3
-
4
-
5
-
6
-
7
-
8
-
9
-
10
-
11
-
12
-
13
-
14
-
15
-
16
-
17
-
18
-
19
-
20
-
21
-
22
-
23
-
24
-
25
-
26
-
27
-
28
-
29
-
30
-
31
-
32
-
33
-
34
-
35
-
36
-
37
-
38
-
39
-
40
-
41
-
42
-
43
-
 44
44 -
 45
45 -
 46
46 -
 47
47 -
 48
48 -
 49
49 -
 50
50 -
 51
51 -
 52
52 -
 53
53 -
 54
54 -
 55
55 -
 56
56 -
 57
57 -
 58
58 -
 59
59 -
 60
60 -
 61
61 -
 62
62 -
 63
63 -
 64
64 -
65
-
66
-
67
-
68
-
69
-
70
-
71
-
72
-
73
-
74
-
75
-
76
-
77
-
78
-
79
-
80
-
81
-
82
-
83
-
84
-
85
-
86
-
87
-
88
-
89
-
90
-
91
-
92
-
93
-
94
-
95
-
96
-
97
-
98
-
99
-
100
-
101
-
102
-
103
-
104
-
105
-
106
-
107
-
108
-
109
-
110
-
111
-
112
-
113
-
114
-
115
-
116
-
117
-
118
-
119
-
120
-
121
-
122
-
123
-
124
-
125
-
126
-
127
-
128
-
129
-
130
-
131
-
132
-
133
-
134
 |
 |

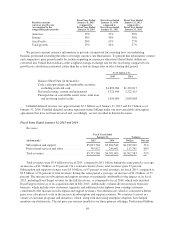
Revenue constant
currency growth rates
(as compared to the
comparable prior periods)
Fiscal Year Ended
January 31, 2015
compared to
Fiscal Year Ended
January 31, 2014
Fiscal Year Ended
January 31, 2014
compared to
Fiscal Year Ended
January 31, 2013
Fiscal Year Ended
January 31, 2013
compared to
Fiscal Year Ended
January 31, 2012
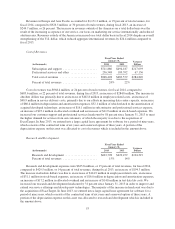
Americas ................... 33% 37% 38%
Europe ..................... 34% 36% 38%
Asia Pacific ................. 26% 19% 27%
Total growth ................ 33% 34% 37%
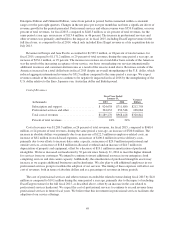
We present constant currency information to provide a framework for assessing how our underlying
business performed excluding the effect of foreign currency rate fluctuations. To present this information, current
and comparative prior period results for entities reporting in currencies other than United States dollars are
converted into United States dollars at the weighted average exchange rate for the year being compared to for
growth rate calculations presented, rather than the actual exchange rates in effect during that period.
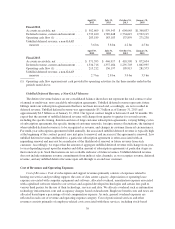
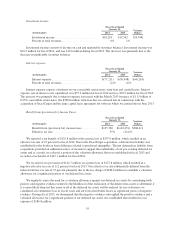
As of January 31,
2015 2014
Balance Sheet Data (in thousands):
Cash, cash equivalents and marketable securities,
excluding restricted cash ..................... $1,890,284 $1,321,017
Deferred revenue, current and noncurrent ......... 3,321,449 2,522,115
Principal due on convertible senior notes, term loan,
and revolving credit facility .................. 1,450,000 2,003,864
Unbilled deferred revenue was approximately $5.7 billion as of January 31, 2015 and $4.5 billion as of
January 31, 2014. Unbilled deferred revenue represents future billings under our non-cancelable subscription
agreements that have not been invoiced and, accordingly, are not recorded in deferred revenue.
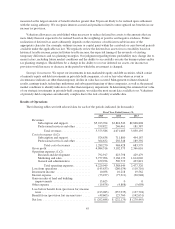
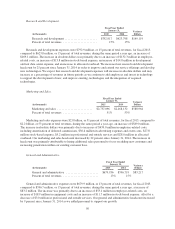
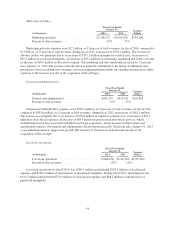
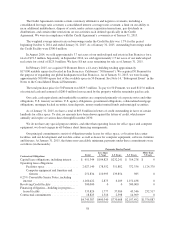
Fiscal Years Ended January 31, 2015 and 2014
Revenues.
Fiscal Year Ended
January 31, Variance
(in thousands) 2015 2014 Dollars Percent
Subscription and support ................. $5,013,764 $3,824,542 $1,189,222 31%
Professional services and other ............ 359,822 246,461 113,361 46%
Total revenues ......................... $5,373,586 $4,071,003 $1,302,583 32%
Total revenues were $5.4 billion for fiscal 2015, compared to $4.1 billion during the same period a year ago,
an increase of $1.3 billion, or 32 percent. On a constant currency basis, total revenues grew 33 percent.
Subscription and support revenues were $5.0 billion, or 93 percent of total revenues, for fiscal 2015, compared to
$3.8 billion, or 94 percent of total revenues, during the same period a year ago, an increase of $1.2 billion, or 31
percent. The increase in subscription and support revenues was primarily attributable to the impact of, in fiscal
2015, including ExactTarget revenue for the full fiscal year, as compared to fiscal 2014, which only included
ExactTarget revenue as of its acquisition date in July 2013. Additionally, volume-driven increases from new
business, which includes new customers, upgrades and additional subscriptions from existing customers
contributed to the increase in subscription and support revenues. Our attrition rate, which is consistent with the
prior year, also played a role in the increase in subscription and support revenues. We continue to invest in a
variety of customer programs and initiatives, which, along with increasing enterprise adoption, have helped
maintain our attrition rate. The net price per user per month for our three primary offerings, Professional Edition,
48