Salesforce.com 2015 Annual Report Download - page 73
Download and view the complete annual report
Please find page 73 of the 2015 Salesforce.com annual report below. You can navigate through the pages in the report by either clicking on the pages listed below, or by using the keyword search tool below to find specific information within the annual report.-
 1
1 -
2
-
3
-
4
-
5
-
6
-
7
-
8
-
9
-
10
-
11
-
12
-
13
-
14
-
15
-
16
-
17
-
18
-
19
-
20
-
21
-
22
-
23
-
24
-
25
-
26
-
27
-
28
-
29
-
30
-
31
-
32
-
33
-
34
-
35
-
36
-
37
-
38
-
39
-
40
-
41
-
42
-
43
-
44
-
45
-
46
-
47
-
48
-
49
-
50
-
51
-
52
-
53
-
54
-
55
-
56
-
57
-
58
-
59
-
60
-
61
-
62
-
 63
63 -
 64
64 -
 65
65 -
 66
66 -
 67
67 -
 68
68 -
 69
69 -
 70
70 -
 71
71 -
 72
72 -
 73
73 -
 74
74 -
 75
75 -
 76
76 -
 77
77 -
 78
78 -
 79
79 -
 80
80 -
 81
81 -
 82
82 -
 83
83 -
84
-
85
-
86
-
87
-
88
-
89
-
90
-
91
-
92
-
93
-
94
-
95
-
96
-
97
-
98
-
99
-
100
-
101
-
102
-
103
-
104
-
105
-
106
-
107
-
108
-
109
-
110
-
111
-
112
-
113
-
114
-
115
-
116
-
117
-
118
-
119
-
120
-
121
-
122
-
123
-
124
-
125
-
126
-
127
-
128
-
129
-
130
-
131
-
132
-
133
-
134
 |
 |
The 0.25% Senior Notes have a fixed annual interest rate of 0.25%, and therefore we do not have economic
interest rate exposure on the Notes. However, the value of the Notes are exposed to interest rate risk. Generally,
the fair values of our fixed interest rate Notes will increase as interest rates fall and decrease as interest rates rise.
In addition, the fair value of our 0.25% Notes is affected by our stock price. The principal balance of our 0.25%
Senior Notes was $1.15 billion as of January 31, 2015. The total estimated fair value of our 0.25% Senior Notes
at January 31, 2015 was $1.3 billion. The fair value was determined based on the closing trading price per $100
of the 0.25% Senior Notes as of the last day of trading for the fourth quarter of fiscal 2015, which was $110.87.
In October 2014, we entered into a credit agreement (the “Credit Agreement”) which provides for a $650.0
million unsecured revolving credit facility that matures in October 2019 (the “Credit Facility”). Immediately
upon closing, we borrowed $300.0 million under the Credit Facility.
Borrowings under the Credit Facility bear interest, at our option, at either a base rate formula, as defined in
the Credit Agreement, or a LIBOR based formula, each as set forth in the Credit Agreement. Additionally, we are
obligated to pay an ongoing commitment fee at a rate between 0.125% and 0.25%. Interest and the commitment
fees are payable in arrears quarterly.
By entering into the Credit Agreement, we have assumed risks associated with variable interest rates based
upon a variable base rate, as defined in the Credit Agreement, or LIBOR. The weighted average interest rate on
the Credit Facility was 1.7% for the period beginning October 6, 2014 and ended January 31, 2015. Changes in
the overall level of interest rates affect the interest expense that we recognize in our statements of operations.
We deposit our cash with multiple financial institutions, therefore our deposits, at times, may exceed
federally insured limits.
The bank counterparties to the derivative contracts potentially expose us to credit-related losses in the event
of their nonperformance. To mitigate that risk, we only contract with counterparties who meet the minimum
requirements under our counterparty risk assessment process. We monitor ratings, credit spreads and potential
downgrades on at least a quarterly basis. Based on our on-going assessment of counterparty risk, we adjust our
exposure to various counterparties. We generally enter into master netting arrangements, which reduce credit risk
by permitting net settlement of transactions with the same counterparty. However, we do not have any master
netting arrangements in place with collateral features.
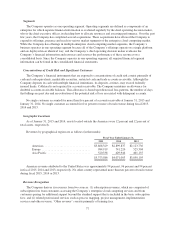
We have an investment portfolio that includes strategic investments in public and privately-held companies,
many of which are in the development stage. When our ownership interests are less than 20 percent and we do
not have the ability to exert significant influence, we account for investments in non-marketable equity and debt
securities of the privately-held companies using the cost method of accounting. Otherwise, we account for the
investments using the equity method of accounting. Our portfolio consists of investments in approximately 100
companies, with our investments in these companies ranging from $0.2 million to $40.0 million. As of
January 31, 2015 and January 31, 2014 the carrying value of our investments in privately-held companies was
$158.0 million and $77.0 million, respectively. The estimated fair value of our investments in privately-held
companies was $280.0 million as of January 31, 2015.
67