Salesforce.com 2015 Annual Report Download - page 51
Download and view the complete annual report
Please find page 51 of the 2015 Salesforce.com annual report below. You can navigate through the pages in the report by either clicking on the pages listed below, or by using the keyword search tool below to find specific information within the annual report.-
 1
1 -
2
-
3
-
4
-
5
-
6
-
7
-
8
-
9
-
10
-
11
-
12
-
13
-
14
-
15
-
16
-
17
-
18
-
19
-
20
-
21
-
22
-
23
-
24
-
25
-
26
-
27
-
28
-
29
-
30
-
31
-
32
-
33
-
34
-
35
-
36
-
37
-
38
-
39
-
40
-
 41
41 -
 42
42 -
 43
43 -
 44
44 -
 45
45 -
 46
46 -
 47
47 -
 48
48 -
 49
49 -
 50
50 -
 51
51 -
 52
52 -
 53
53 -
 54
54 -
 55
55 -
 56
56 -
 57
57 -
 58
58 -
 59
59 -
 60
60 -
 61
61 -
62
-
63
-
64
-
65
-
66
-
67
-
68
-
69
-
70
-
71
-
72
-
73
-
74
-
75
-
76
-
77
-
78
-
79
-
80
-
81
-
82
-
83
-
84
-
85
-
86
-
87
-
88
-
89
-
90
-
91
-
92
-
93
-
94
-
95
-
96
-
97
-
98
-
99
-
100
-
101
-
102
-
103
-
104
-
105
-
106
-
107
-
108
-
109
-
110
-
111
-
112
-
113
-
114
-
115
-
116
-
117
-
118
-
119
-
120
-
121
-
122
-
123
-
124
-
125
-
126
-
127
-
128
-
129
-
130
-
131
-
132
-
133
-
134
 |
 |

measured as the largest amount of benefit which is greater than 50 percent likely to be realized upon settlement
with the taxing authority. We recognize interest accrued and penalties related to unrecognized tax benefits in our
income tax provision.
Valuation allowances are established when necessary to reduce deferred tax assets to the amounts that are
more likely than not expected to be realized based on the weighting of positive and negative evidence. Future
realization of deferred tax assets ultimately depends on the existence of sufficient taxable income of the
appropriate character (for example, ordinary income or capital gain) within the carryback or carryforward periods
available under the applicable tax law. We regularly review the deferred tax assets for recoverability based on
historical taxable income, projected future taxable income, the expected timing of the reversals of existing
temporary differences and tax planning strategies. Our judgment regarding future profitability may change due to
many factors, including future market conditions and the ability to successfully execute the business plans and/or
tax planning strategies. Should there be a change in the ability to recover deferred tax assets, our income tax
provision would increase or decrease in the period in which the assessment is changed.
Strategic Investments. We report our investments in non-marketable equity and debt securities, which consist
of minority equity and debt investments in privately-held companies, at cost or fair value when an event or
circumstance indicates an other-than-temporary decline in value has occurred. Management evaluates financial
results, earnings trends, technology milestones and subsequent financing of these companies, as well as the general
market conditions to identify indicators of other-than-temporary impairment. In determining the estimated fair value
of our strategic investments in privately-held companies, we utilize the most recent data available to us. Valuations
of privately-held companies are inherently complex due to the lack of readily available data.
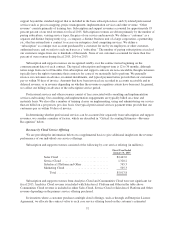
Results of Operations
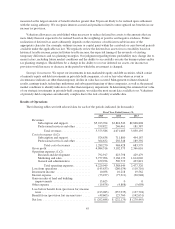
The following tables set forth selected data for each of the periods indicated (in thousands):
Fiscal Year Ended January 31,
2015 2014 2013
Revenues:
Subscription and support ............... $5,013,764 $3,824,542 $2,868,808
Professional services and other .......... 359,822 246,461 181,387
Total revenues ................... 5,373,586 4,071,003 3,050,195
Cost of revenues (1)(2):
Subscription and support ............... 924,638 711,880 494,187
Professional services and other .......... 364,632 256,548 189,392
Total cost of revenues ............. 1,289,270 968,428 683,579
Gross profit ............................. 4,084,316 3,102,575 2,366,616
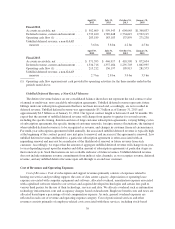
Operating expenses (1)(2):
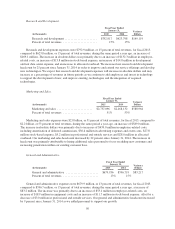
Research and development ............. 792,917 623,798 429,479
Marketing and sales ................... 2,757,096 2,168,132 1,614,026
General and administrative ............. 679,936 596,719 433,821
Total operating expenses ........... 4,229,949 3,388,649 2,477,326
Loss from operations ...................... (145,633) (286,074) (110,710)
Investment income ....................... 10,038 10,218 19,562
Interest expense .......................... (73,237) (77,211) (30,948)
Gain on sales of land and building
improvements ......................... 15,625 0 0
Other expense ........................... (19,878) (4,868) (5,698)
Loss before benefit from (provision for) income
taxes ................................. (213,085) (357,935) (127,794)
Benefit from (provision for) income taxes ..... (49,603) 125,760 (142,651)
Net loss ................................ $ (262,688) $ (232,175) $ (270,445)
45