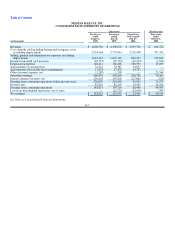
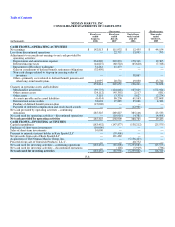
Neiman Marcus 2007 Annual Report Download - page 95
Download and view the complete annual report
Please find page 95 of the 2007 Neiman Marcus annual report below. You can navigate through the pages in the report by either clicking on the pages listed below, or by using the keyword search tool below to find specific information within the annual report.-
 1
1 -
2
-
3
-
4
-
5
-
6
-
7
-
8
-
9
-
10
-
11
-
12
-
13
-
14
-
15
-
16
-
17
-
18
-
19
-
20
-
21
-
22
-
23
-
24
-
25
-
26
-
27
-
28
-
29
-
30
-
31
-
32
-
33
-
34
-
35
-
36
-
37
-
38
-
39
-
40
-
41
-
42
-
43
-
44
-
45
-
46
-
47
-
48
-
49
-
50
-
51
-
52
-
53
-
54
-
55
-
56
-
57
-
58
-
59
-
60
-
61
-
62
-
63
-
64
-
65
-
66
-
67
-
68
-
69
-
70
-
71
-
72
-
73
-
74
-
75
-
76
-
77
-
78
-
79
-
80
-
81
-
82
-
83
-
84
-
 85
85 -
 86
86 -
 87
87 -
 88
88 -
 89
89 -
 90
90 -
 91
91 -
 92
92 -
 93
93 -
 94
94 -
 95
95 -
 96
96 -
 97
97 -
 98
98 -
 99
99 -
 100
100 -
 101
101 -
 102
102 -
 103
103 -
 104
104 -
 105
105 -
106
-
107
-
108
-
109
-
110
-
111
-
112
-
113
-
114
-
115
-
116
-
117
-
118
-
119
-
120
-
121
-
122
-
123
-
124
-
125
-
126
-
127
-
128
-
129
-
130
-
131
-
132
-
133
-
134
-
135
-
136
-
137
-
138
-
139
-
140
-
141
-
142
-
143
-
144
-
145
-
146
-
147
-
148
-
149
-
150
-
151
-
152
-
153
-
154
-
155
-
156
-
157
-
158
-
159
-
160
-
161
-
162
-
163
-
164
-
165
-
166
-
167
-
168
-
169
-
170
-
171
-
172
-
173
-
174
-
175
-
176
-
177
-
178
-
179
-
180
-
181
-
182
-
183
-
184
-
185
-
186
-
187
-
188
-
189
-
190
-
191
-
192
-
193
-
194
-
195
-
196
-
197
-
198
-
199
-
200
-
201
-
202
-
203
-
204
-
205
-
206
 |
 |

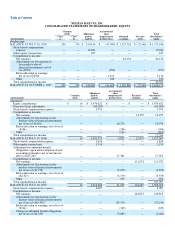
Table of Contents
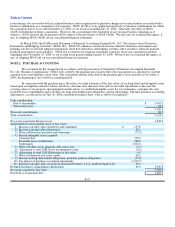
NEIMAN MARCUS, INC.
CONSOLIDATED STATEMENTS OF SHAREHOLDERS' EQUITY
Common Accumulated
stocks Additional other Total
(in thousands)
Class
A
Class
B
paid-in
capital
comprehensive
income (loss)
Retained
earnings
Treasury
stock
shareholders'
equity
Predecessor:
BALANCE AT JULY 30, 2005 298 199 $ 520,414 $ (47,030) $ 1,125,726 $ (25,661) $ 1,573,946
Stock based compensation
expense — — 19,032 — — — 19,032
Other equity transactions — — 637 — — — 637
Comprehensive income:
Net earnings — — — — 44,154 — 44,154
Adjustments for fluctuations in
fair market value of
financial instruments, net of
tax ($593) — — — (950) — — (950)
Reclassification to earnings,
net of tax of $706 — — — 1,114 — — 1,114
Other — — — 246 — — 246
Total comprehensive income 44,564
BALANCE AT OCTOBER 1, 2005 298 199 $ 540,083 $ (46,620)$ 1,169,880 $ (25,661)$ 1,638,179
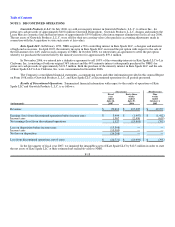
(in thousands)
Common
stock
Additional
paid-in
capital
Accumulated
other
comprehensive
income (loss)
Retained
earnings
Total
shareholders'
equity
Successor:
Equity contributions $ 10 $ 1,470,622 $ — $ — $ 1,470,632
Carryover basis adjustment — (69,200) — — (69,200)
Stock based compensation expense — 3,951 — — 3,951
Comprehensive income:
Net earnings — — — 12,455 12,455
Adjustments for fluctuations in fair
market value of financial instruments,
net of tax of $6,696 — — 10,276 — 10,276
Reclassification to earnings, net of tax of
($186) — — (286) — (286)
Other — — (161) — (161)
Total comprehensive income 22,284
BALANCE AT JULY 29, 2006 10 1,405,373 9,829 12,455 1,427,667
Stock based compensation expense — 5,859 — — 5,859
Other equity transactions — 1,154 — — 1,154
Adjustment for unfunded benefit
obligations (upon initial adoption of new
accounting principle), net of income tax
effect of $11,289 — — 17,365 — 17,365
Comprehensive income:
Net earnings — — — 111,932 111,932
Adjustments for fluctuations in fair
market value of financial instruments,
net of tax of ($1,758) — — (2,678) — (2,678)
Reclassification to earnings, net of tax of
($2,327) — — (3,579) — (3,579)
Other — — 292 — 292
Total comprehensive income 105,967
BALANCE AT JULY 28, 2007 10 1,412,386 21,229 124,387 1,558,012
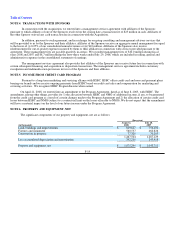
Stock based compensation expense — 6,087 — — 6,087
Comprehensive income:
Net earnings — — — 142,813 142,813
Adjustments for fluctuations in fair
market value of financial instruments,
net of tax of ($16,355) — — (25,159) — (25,159)
Reclassification to earnings, net of tax of
($214) — — (329) — (329)
Change in unfunded benefit obligations,
net of tax of ($3,239) — — (5,063) — (5,063)