Neiman Marcus 2007 Annual Report Download - page 130
Download and view the complete annual report
Please find page 130 of the 2007 Neiman Marcus annual report below. You can navigate through the pages in the report by either clicking on the pages listed below, or by using the keyword search tool below to find specific information within the annual report.-
 1
1 -
2
-
3
-
4
-
5
-
6
-
7
-
8
-
9
-
10
-
11
-
12
-
13
-
14
-
15
-
16
-
17
-
18
-
19
-
20
-
21
-
22
-
23
-
24
-
25
-
26
-
27
-
28
-
29
-
30
-
31
-
32
-
33
-
34
-
35
-
36
-
37
-
38
-
39
-
40
-
41
-
42
-
43
-
44
-
45
-
46
-
47
-
48
-
49
-
50
-
51
-
52
-
53
-
54
-
55
-
56
-
57
-
58
-
59
-
60
-
61
-
62
-
63
-
64
-
65
-
66
-
67
-
68
-
69
-
70
-
71
-
72
-
73
-
74
-
75
-
76
-
77
-
78
-
79
-
80
-
81
-
82
-
83
-
84
-
85
-
86
-
87
-
88
-
89
-
90
-
91
-
92
-
93
-
94
-
95
-
96
-
97
-
98
-
99
-
100
-
101
-
102
-
103
-
104
-
105
-
106
-
107
-
108
-
109
-
110
-
111
-
112
-
113
-
114
-
115
-
116
-
117
-
118
-
119
-
 120
120 -
 121
121 -
 122
122 -
 123
123 -
 124
124 -
 125
125 -
 126
126 -
 127
127 -
 128
128 -
 129
129 -
 130
130 -
 131
131 -
 132
132 -
 133
133 -
 134
134 -
 135
135 -
 136
136 -
 137
137 -
 138
138 -
 139
139 -
 140
140 -
141
-
142
-
143
-
144
-
145
-
146
-
147
-
148
-
149
-
150
-
151
-
152
-
153
-
154
-
155
-
156
-
157
-
158
-
159
-
160
-
161
-
162
-
163
-
164
-
165
-
166
-
167
-
168
-
169
-
170
-
171
-
172
-
173
-
174
-
175
-
176
-
177
-
178
-
179
-
180
-
181
-
182
-
183
-
184
-
185
-
186
-
187
-
188
-
189
-
190
-
191
-
192
-
193
-
194
-
195
-
196
-
197
-
198
-
199
-
200
-
201
-
202
-
203
-
204
-
205
-
206
 |
 |

Table of Contents
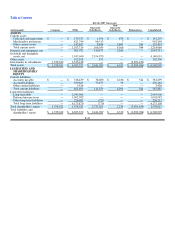
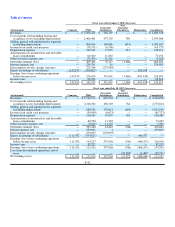
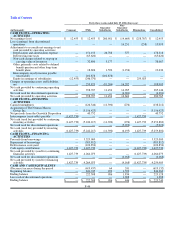
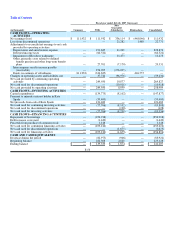
Fiscal year ended August 2, 2008 (Successor)
(in thousands) Company NMG
Guarantor
Subsidiaries
Non-
Guarantor
Subsidiaries Eliminations Consolidated
CASH FLOWS—OPERATING
ACTIVITIES
Net earnings (loss) $ 142,813 $ 142,813 $ 351,691 $ (1,066) $ (493,438) $ 142,813
Adjustments to reconcile net earnings to net
cash provided by operating activities:
Depreciation and amortization expense — 204,389 29,510 921 — 234,820
Deferred income taxes — (44,627) — — — (44,627)
Impairment of Horchow tradename — — 31,261 — — 31,261
Gain on curtailment of defined benefit
retirement obligations — (32,450) — — — (32,450)
Other, primarily costs related to defined
benefit pension and other long-term
benefit plans — 21,677 320 — — 21,997
Intercompany royalty income payable
(receivable) — 273,584 (273,584) — — —
Equity in earnings of subsidiaries (142,813) (350,625) — — 493,438 —
Changes in operating assets and liabilities,
net — 60,247 (128,006)(730)— (68,489)
Net cash provided by (used for) operating
activities — 275,008 11,192 (875)— 285,325
CASH FLOWS—INVESTING
ACTIVITIES
Capital expenditures — (172,237) (11,787) 572 — (183,452)
Purchases of short-term investments — (10,000) — — — (10,000)
Sales of short-term investments — 10,000 — — — 10,000
Net cash (used for) provided by investing
activities — (172,237)(11,787)572 — (183,452)
CASH FLOWS—FINANCING
ACTIVITIES
Repayment of borrowings — (3,900)— — — (3,900)
Net cash used for financing activities — (3,900)— — — (3,900)
CASH AND CASH EQUIVALENTS
Increase (decrease) during the period — 98,871 (595) (303) — 97,973
Beginning balance — 139,333 1,196 678 — 141,207
Ending balance $ — $ 238,204 $ 601 $ 375 $ — $ 239,180
F-44