Neiman Marcus 2007 Annual Report Download - page 126
Download and view the complete annual report
Please find page 126 of the 2007 Neiman Marcus annual report below. You can navigate through the pages in the report by either clicking on the pages listed below, or by using the keyword search tool below to find specific information within the annual report.-
 1
1 -
2
-
3
-
4
-
5
-
6
-
7
-
8
-
9
-
10
-
11
-
12
-
13
-
14
-
15
-
16
-
17
-
18
-
19
-
20
-
21
-
22
-
23
-
24
-
25
-
26
-
27
-
28
-
29
-
30
-
31
-
32
-
33
-
34
-
35
-
36
-
37
-
38
-
39
-
40
-
41
-
42
-
43
-
44
-
45
-
46
-
47
-
48
-
49
-
50
-
51
-
52
-
53
-
54
-
55
-
56
-
57
-
58
-
59
-
60
-
61
-
62
-
63
-
64
-
65
-
66
-
67
-
68
-
69
-
70
-
71
-
72
-
73
-
74
-
75
-
76
-
77
-
78
-
79
-
80
-
81
-
82
-
83
-
84
-
85
-
86
-
87
-
88
-
89
-
90
-
91
-
92
-
93
-
94
-
95
-
96
-
97
-
98
-
99
-
100
-
101
-
102
-
103
-
104
-
105
-
106
-
107
-
108
-
109
-
110
-
111
-
112
-
113
-
114
-
115
-
 116
116 -
 117
117 -
 118
118 -
 119
119 -
 120
120 -
 121
121 -
 122
122 -
 123
123 -
 124
124 -
 125
125 -
 126
126 -
 127
127 -
 128
128 -
 129
129 -
 130
130 -
 131
131 -
 132
132 -
 133
133 -
 134
134 -
 135
135 -
 136
136 -
137
-
138
-
139
-
140
-
141
-
142
-
143
-
144
-
145
-
146
-
147
-
148
-
149
-
150
-
151
-
152
-
153
-
154
-
155
-
156
-
157
-
158
-
159
-
160
-
161
-
162
-
163
-
164
-
165
-
166
-
167
-
168
-
169
-
170
-
171
-
172
-
173
-
174
-
175
-
176
-
177
-
178
-
179
-
180
-
181
-
182
-
183
-
184
-
185
-
186
-
187
-
188
-
189
-
190
-
191
-
192
-
193
-
194
-
195
-
196
-
197
-
198
-
199
-
200
-
201
-
202
-
203
-
204
-
205
-
206
 |
 |

Table of Contents
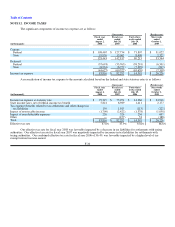
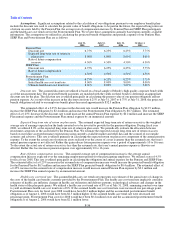
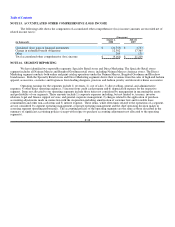
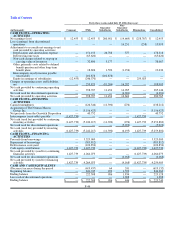
For the nine weeks ended October 1, 2005, other income (expense), net includes $23.5 million of transaction and other costs
incurred in connection with the Acquisition. These costs consist primarily of $4.5 million of accounting, investment banking, legal and
other costs associated with the Acquisition and a $19.0 million non-cash charge for stock compensation resulting from the accelerated
vesting of Predecessor stock options and restricted stock in connection with the Acquisition.
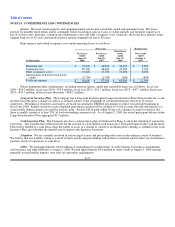
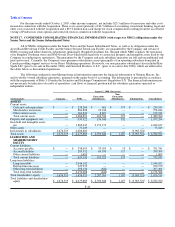
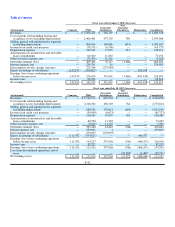
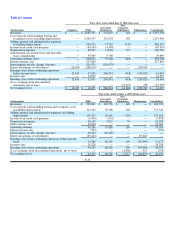
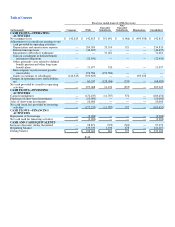
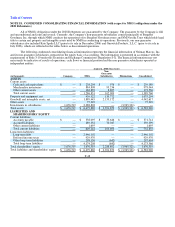
NOTE 17. CONDENSED CONSOLIDATING FINANCIAL INFORMATION (with respect to NMG's obligations under the
Senior Notes and the Senior Subordinated Notes)
All of NMG's obligations under the Senior Notes and the Senior Subordinated Notes, as well as its obligations under the
Asset-Based Revolving Credit Facility and the Senior Secured Term Loan Facility, are guaranteed by the Company and certain of
NMG's existing and future domestic subsidiaries (principally, Bergdorf Goodman, Inc. through which NMG conducts the operations
of its Bergdorf Goodman stores and NM Nevada Trust which holds legal title to certain real property and intangible assets used by the
Company in conducting its operations). The guarantees by the Company and each subsidiary guarantor are full and unconditional and
joint and several. Currently, the Company's non-guarantor subsidiaries consist principally of an operating subsidiary domiciled in
Canada providing support services to our Direct Marketing operations. Previously, our non-guarantor subsidiaries also included Kate
Spade LLC (prior to its sale in December 2006) and Gurwitch Products, L.L.C. (prior to its sale in July 2006), which are reflected in
the tables below as discontinued operations.
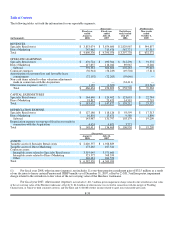
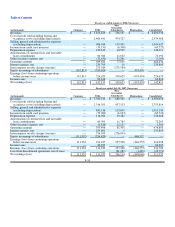
The following condensed consolidating financial information represents the financial information of Neiman Marcus, Inc.
and its wholly-owned subsidiary guarantors, prepared on the equity basis of accounting. The information is presented in accordance
with the requirements of Rule 3-10 under the Securities and Exchange Commission's Regulation S-X. The financial information may
not necessarily be indicative of results of operations, cash flows or financial position had the subsidiary guarantors operated as
independent entities.
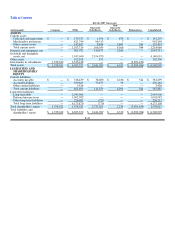
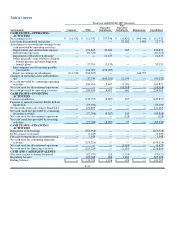
August 2, 2008 (Successor)
(in thousands) Company NMG
Guarantor
Subsidiaries
Non-
Guarantor
Subsidiaries Eliminations Consolidated
ASSETS
Current assets:
Cash and cash equivalents $ — $ 238,204 $ 601 $ 375 $ — $ 239,180
Merchandise inventories — 884,808 93,236 — — 978,044
Other current assets — 163,839 8,697 — — 172,536
Total current assets — 1,286,851 102,534 375 — 1,389,760
Property and equipment, net — 939,522 134,940 832 — 1,075,294
Goodwill and intangible assets,
net — 1,889,445 2,153,172 — — 4,042,617
Other assets — 75,249 — — — 75,249
Investments in subsidiaries 1,676,519 2,288,802 — — (3,965,321)—
Total assets $ 1,676,519 $ 6,479,869 $ 2,390,646 $ 1,207 $ (3,965,321) $ 6,582,920
LIABILITIES AND
SHAREHOLDERS'
EQUITY
Current liabilities:
Accounts payable $ — $ 338,095 $ 33,593 $ 53 $ — $ 371,741
Accrued liabilities — 289,352 69,930 117 — 359,399
Other current liabilities — 1,695 — — — 1,695
Total current liabilities — 629,142 103,523 170 — 732,835
Long-term liabilities:
Long-term debt — 2,946,102 — — — 2,946,102
Deferred income taxes — 929,970 — — — 929,970
Other long-term liabilities — 298,136 (642)— — 297,494
Total long-term liabilities — 4,174,208 (642)— — 4,173,566
Total shareholders' equity 1,676,519 1,676,519 2,287,765 1,037 (3,965,321)1,676,519
Total liabilities and shareholders'
equity $ 1,676,519 $ 6,479,869 $ 2,390,646 $ 1,207 $ (3,965,321)$ 6,582,920
F-40