Neiman Marcus 2007 Annual Report Download - page 65
Download and view the complete annual report
Please find page 65 of the 2007 Neiman Marcus annual report below. You can navigate through the pages in the report by either clicking on the pages listed below, or by using the keyword search tool below to find specific information within the annual report.-
 1
1 -
2
-
3
-
4
-
5
-
6
-
7
-
8
-
9
-
10
-
11
-
12
-
13
-
14
-
15
-
16
-
17
-
18
-
19
-
20
-
21
-
22
-
23
-
24
-
25
-
26
-
27
-
28
-
29
-
30
-
31
-
32
-
33
-
34
-
35
-
36
-
37
-
38
-
39
-
40
-
41
-
42
-
43
-
44
-
45
-
46
-
47
-
48
-
49
-
50
-
51
-
52
-
53
-
54
-
 55
55 -
 56
56 -
 57
57 -
 58
58 -
 59
59 -
 60
60 -
 61
61 -
 62
62 -
 63
63 -
 64
64 -
 65
65 -
 66
66 -
 67
67 -
 68
68 -
 69
69 -
 70
70 -
 71
71 -
 72
72 -
 73
73 -
 74
74 -
 75
75 -
76
-
77
-
78
-
79
-
80
-
81
-
82
-
83
-
84
-
85
-
86
-
87
-
88
-
89
-
90
-
91
-
92
-
93
-
94
-
95
-
96
-
97
-
98
-
99
-
100
-
101
-
102
-
103
-
104
-
105
-
106
-
107
-
108
-
109
-
110
-
111
-
112
-
113
-
114
-
115
-
116
-
117
-
118
-
119
-
120
-
121
-
122
-
123
-
124
-
125
-
126
-
127
-
128
-
129
-
130
-
131
-
132
-
133
-
134
-
135
-
136
-
137
-
138
-
139
-
140
-
141
-
142
-
143
-
144
-
145
-
146
-
147
-
148
-
149
-
150
-
151
-
152
-
153
-
154
-
155
-
156
-
157
-
158
-
159
-
160
-
161
-
162
-
163
-
164
-
165
-
166
-
167
-
168
-
169
-
170
-
171
-
172
-
173
-
174
-
175
-
176
-
177
-
178
-
179
-
180
-
181
-
182
-
183
-
184
-
185
-
186
-
187
-
188
-
189
-
190
-
191
-
192
-
193
-
194
-
195
-
196
-
197
-
198
-
199
-
200
-
201
-
202
-
203
-
204
-
205
-
206
 |
 |

Table of Contents
in The Wall Street Journal on the last business day of the preceding calendar quarter plus two percentage points, which
averaged approximately 7.5 percent during the year) that exceeds 120 percent of the applicable federal long-term interest rate
as follows: $11,369 for Ms. Katz; $3,653 for Mr. Skinner; and $914 for Mr. Hoffman.
(5)
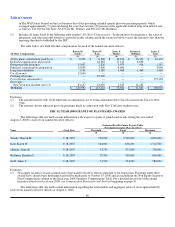
Includes all items listed in the following table entitled "All Other Compensation." In the interest of transparency, the value of
perquisites and other personal benefits is provided in this column and in the footnotes below even if the amount is less than the
reporting threshold established by the SEC.
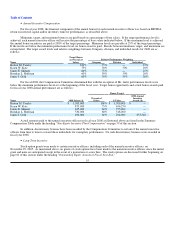
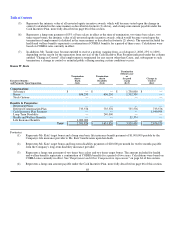
The table below sets forth all other compensation for each of the named executive officers.
All Other Compensation
Burton M.
Tansky
Karen W.
Katz
James E.
Skinner
Brendan L.
Hoffman
James J.
Gold
($) ($) ($) ($) ($)
401(k) plans contributions paid by us $ 6,900 $ 6,900 $ 10,350 $ 10,350 $ 10,350
Deferred compensation plan match — 48,868 27,145 6,898 —
Group term life insurance 15,867 2,326 3,075 926 1,185
Financial counseling/tax preparation 24,898 3,000 6,000 — 3,000
Long-term disability 3,180 3,180 1,468 1,468 1,468
Car allowance 12,000 — — — —
Clothing allowance — 25,000 — — —
Cost of living adjustment(1) — — — — 179,998
Gross ups: — — — — —
New York non-resident taxes (2) 83,147 24,050 4,343 12,181 —
TOTALS $ 145,992 $ 113,324 $ 52,381 $ 31,823 $ 196,001
Footnotes:
(1)
The amount listed for Mr. Gold represents an annualized cost of living adjustment due to his relocation from Texas to New
York.
(2) The amounts shown represent gross up payments made in connection with New York non-resident taxes.
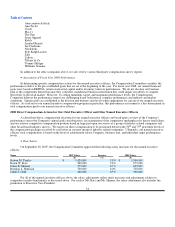
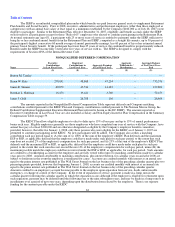
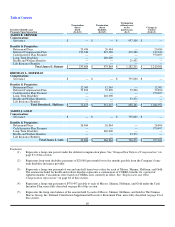
FISCAL YEAR 2008 GRANTS OF PLAN BASED AWARDS
The following table sets forth certain information with respect to grants of plan-based awards during the year ended
August 2, 2008 to each of our named executive officers.
Estimated Possible Future Payouts Under
Non-Equity Incentive Plan Awards(1)
Name Grant Date Threshold Target Maximum
($) ($) ($)
Tansky, Burton M. 9-18-2007 750,000 1,500,000 3,000,000
Katz, Karen W. 9-18-2007 164,063 656,250 1,312,500
Skinner, James E. 9-18-2007 93,730 375,000 750,000
Hoffman, Brendan L. 9-18-2007 79,500 318,000 636,000
Gold, James J. 9-18-2007 73,500 294,000 588,000
Footnotes:
(1)
Non-equity incentive awards granted each of the named executive officers pursuant to the bonus plan. Payments under these
awards have already been determined and will be made prior to October 15, 2008 and are included in the Non-Equity Incentive
Plan Compensation column of the fiscal year 2008 Summary Compensation Table. For a detailed discussion of the annual
incentive awards for fiscal year 2008, see Compensation Discussion and Analysis beginning on page 51.
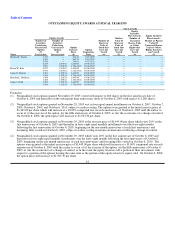
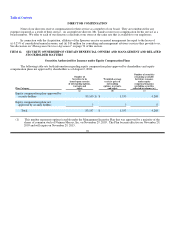
The following table sets forth certain information regarding the total number and aggregate value of stock options held by
each of our named executive officers at August 2, 2008.
60