Neiman Marcus 2007 Annual Report Download - page 36
Download and view the complete annual report
Please find page 36 of the 2007 Neiman Marcus annual report below. You can navigate through the pages in the report by either clicking on the pages listed below, or by using the keyword search tool below to find specific information within the annual report.-
 1
1 -
2
-
3
-
4
-
5
-
6
-
7
-
8
-
9
-
10
-
11
-
12
-
13
-
14
-
15
-
16
-
17
-
18
-
19
-
20
-
21
-
22
-
23
-
24
-
25
-
 26
26 -
 27
27 -
 28
28 -
 29
29 -
 30
30 -
 31
31 -
 32
32 -
 33
33 -
 34
34 -
 35
35 -
 36
36 -
 37
37 -
 38
38 -
 39
39 -
 40
40 -
 41
41 -
 42
42 -
 43
43 -
 44
44 -
 45
45 -
 46
46 -
47
-
48
-
49
-
50
-
51
-
52
-
53
-
54
-
55
-
56
-
57
-
58
-
59
-
60
-
61
-
62
-
63
-
64
-
65
-
66
-
67
-
68
-
69
-
70
-
71
-
72
-
73
-
74
-
75
-
76
-
77
-
78
-
79
-
80
-
81
-
82
-
83
-
84
-
85
-
86
-
87
-
88
-
89
-
90
-
91
-
92
-
93
-
94
-
95
-
96
-
97
-
98
-
99
-
100
-
101
-
102
-
103
-
104
-
105
-
106
-
107
-
108
-
109
-
110
-
111
-
112
-
113
-
114
-
115
-
116
-
117
-
118
-
119
-
120
-
121
-
122
-
123
-
124
-
125
-
126
-
127
-
128
-
129
-
130
-
131
-
132
-
133
-
134
-
135
-
136
-
137
-
138
-
139
-
140
-
141
-
142
-
143
-
144
-
145
-
146
-
147
-
148
-
149
-
150
-
151
-
152
-
153
-
154
-
155
-
156
-
157
-
158
-
159
-
160
-
161
-
162
-
163
-
164
-
165
-
166
-
167
-
168
-
169
-
170
-
171
-
172
-
173
-
174
-
175
-
176
-
177
-
178
-
179
-
180
-
181
-
182
-
183
-
184
-
185
-
186
-
187
-
188
-
189
-
190
-
191
-
192
-
193
-
194
-
195
-
196
-
197
-
198
-
199
-
200
-
201
-
202
-
203
-
204
-
205
-
206
 |
 |

Table of Contents
related to the writedown to fair value of the net carrying value of the Horchow tradename.
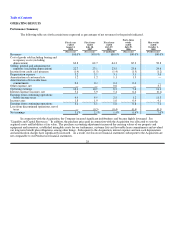
Segment operating earnings. Segment operating earnings for our Specialty Retail stores and Direct Marketing segments do
not reflect the impact of adjustments to revalue our assets and liabilities to estimated fair value at the Acquisition date.
Operating earnings for our Specialty Retail stores segment were $476.7 million, or 12.4% of Specialty Retail stores revenues,
for fiscal year ended August 2, 2008 compared to $490.6 million, or 13.4% of Specialty Retail stores revenues, for the prior fiscal
year. The decrease in operating margin as a percentage of revenues was primarily due to:
• lower than anticipated demand resulting in a lower level of full-price sales and higher markdowns; and
• net increases in advertising and promotion costs; partially offset by
• lower estimated annual incentive compensation costs.
Operating earnings for Direct Marketing were $117.7 million, or 15.7% of Direct Marketing revenues, in fiscal year 2008
compared to $116.0 million, or 16.2% of Direct Marketing revenues, for the prior fiscal year. The decrease in operating margin as a
percentage of revenues for Direct Marketing was primarily the result of 1) a decrease in margins realized on delivery and processing
revenues, partially offset by 2) a decrease in advertising and marketing costs, as a percentage of revenues, due to the continued growth
in internet revenues.
Total operating earnings in fiscal year 2008 were $466.4 million, or 10.1% of revenues. Total operating earnings in fiscal
year 2007 were $476.8 million, or 10.9% of revenues. Operating earnings margin decreased in fiscal year 2008 by 0.8% of revenues
as a result of 1) an increase in COGS by 1.1% of revenues due primarily to lower margins at both Specialty Retail stores and Direct
Marketing, partially offset by 2) a decrease in SG&A expenses by 0.4% of revenues (primarily lower incentive compensation).
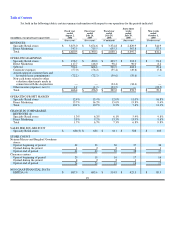
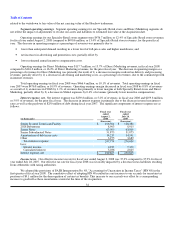
Interest expense, net. Net interest expense was $239.8 million, or 5.2% of revenues, in fiscal year 2008 and $259.8 million,
or 5.9% of revenues, for the prior fiscal year. The decrease in interest expense is primarily due to the decrease in term loan interest
rates as well as the paydown of $250 million of debt during fiscal year 2007. The significant components of interest expense are as
follows:
(in thousands)
Fiscal year
ended
August 2,
2008
Fiscal year
ended
July 28,
2007
(Successor) (Successor)
Senior Secured Term Loan Facility $ 106,504 $ 128,380
2028 Debentures 8,903 8,915
Senior Notes 63,000 63,000
Senior Subordinated Notes 51,875 51,875
Amortization of debt issue costs 14,217 14,141
Other 3,275 3,689
Total interest expense 247,774 270,000
Less:
Interest income 4,933 7,370
Capitalized interest 3,036 2,825
Interest expense, net $ 239,805 $ 259,805
Income taxes. Our effective income tax rate for fiscal year ended August 2, 2008 was 37.0% compared to 37.9% for fiscal
year ended July 28, 2007. Our effective tax rate for fiscal year 2008 was favorably impacted by a decrease in tax liabilities resulting
from settlements with taxing authorities.
We adopted the provisions of FASB Interpretation No. 48, "Accounting for Uncertainty in Income Taxes" (FIN 48) in the
first quarter of fiscal year 2008. The cumulative effect of adopting FIN 48 resulted in a net increase to our accruals for uncertain tax
positions of $9.1 million for the derecognition of certain tax benefits. This increase to our accruals was offset by a corresponding
increase to goodwill as these uncertainties existed at the time of the Acquisition.
32