Neiman Marcus 2007 Annual Report Download - page 40
Download and view the complete annual report
Please find page 40 of the 2007 Neiman Marcus annual report below. You can navigate through the pages in the report by either clicking on the pages listed below, or by using the keyword search tool below to find specific information within the annual report.-
 1
1 -
2
-
3
-
4
-
5
-
6
-
7
-
8
-
9
-
10
-
11
-
12
-
13
-
14
-
15
-
16
-
17
-
18
-
19
-
20
-
21
-
22
-
23
-
24
-
25
-
26
-
27
-
28
-
29
-
 30
30 -
 31
31 -
 32
32 -
 33
33 -
 34
34 -
 35
35 -
 36
36 -
 37
37 -
 38
38 -
 39
39 -
 40
40 -
 41
41 -
 42
42 -
 43
43 -
 44
44 -
 45
45 -
 46
46 -
 47
47 -
 48
48 -
 49
49 -
 50
50 -
51
-
52
-
53
-
54
-
55
-
56
-
57
-
58
-
59
-
60
-
61
-
62
-
63
-
64
-
65
-
66
-
67
-
68
-
69
-
70
-
71
-
72
-
73
-
74
-
75
-
76
-
77
-
78
-
79
-
80
-
81
-
82
-
83
-
84
-
85
-
86
-
87
-
88
-
89
-
90
-
91
-
92
-
93
-
94
-
95
-
96
-
97
-
98
-
99
-
100
-
101
-
102
-
103
-
104
-
105
-
106
-
107
-
108
-
109
-
110
-
111
-
112
-
113
-
114
-
115
-
116
-
117
-
118
-
119
-
120
-
121
-
122
-
123
-
124
-
125
-
126
-
127
-
128
-
129
-
130
-
131
-
132
-
133
-
134
-
135
-
136
-
137
-
138
-
139
-
140
-
141
-
142
-
143
-
144
-
145
-
146
-
147
-
148
-
149
-
150
-
151
-
152
-
153
-
154
-
155
-
156
-
157
-
158
-
159
-
160
-
161
-
162
-
163
-
164
-
165
-
166
-
167
-
168
-
169
-
170
-
171
-
172
-
173
-
174
-
175
-
176
-
177
-
178
-
179
-
180
-
181
-
182
-
183
-
184
-
185
-
186
-
187
-
188
-
189
-
190
-
191
-
192
-
193
-
194
-
195
-
196
-
197
-
198
-
199
-
200
-
201
-
202
-
203
-
204
-
205
-
206
 |
 |

Table of Contents
Non-GAAP Financial Measure - EBITDA
We present the non-GAAP financial measure EBITDA because we use this measure to monitor and evaluate the performance
of our business and believe the presentation of this measure will enhance investors' ability to analyze trends in our business, evaluate
our performance relative to other companies in our industry and evaluate our ability to service our debt. In addition, we use EBITDA
as a component of the measurement of incentive compensation.
EBITDA is not a presentation made in accordance with GAAP and our computation of EBITDA may vary from others in our
industry. In addition, EBITDA contains some, but not all, adjustments that are taken into account in the calculation of the components
of various covenants in the indentures governing NMG's senior secured Asset-Based Revolving Credit Facility, Senior Secured Term
Loan Facility, Senior Notes and Senior Subordinated Notes. EBITDA should not be considered as an alternative to operating earnings
or net earnings as measures of operating performance or cash flows as measures of liquidity. EBITDA has important limitations as an
analytical tool and should not be considered in isolation, or as a substitute for analysis of our results as reported under GAAP. For
example, EBITDA:
• does not reflect our cash expenditures, or future requirements, for capital expenditures or contractual commitments;
• does not reflect changes in, or cash requirements for, our working capital needs;
• does not reflect our considerable interest expense, or the cash requirements necessary to service interest or principal
payments, on our debt;
• excludes tax payments that represent a reduction in cash available; and
• does not reflect any cash requirements for assets being depreciated and amortized that may have to be replaced in the
future.
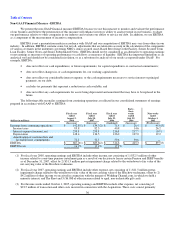
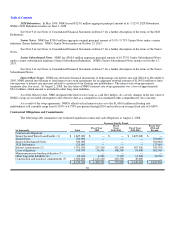
The following table reconciles earnings from continuing operations as reflected in our consolidated statements of earnings
prepared in accordance with GAAP to EBITDA:
(dollars in millions)
Fiscal year
ended
August 2,
2008
Fiscal year
ended
July 28,
2007
Fiscal year
ended
July 29,
2006
Forty-
three
weeks
ended
July 29,
2006
Nine weeks
ended
October 1,
2005
(Successor) (Successor) (Combined) (Successor) (Predecessor)
Earnings from continuing operations $ 142.8(1) $ 134.7(2) $ 71.4 $ 26.4 $ 45.0(3)
Income taxes 83.8 82.3 40.8 14.6 26.2
Interest expense (income), net 239.8 259.8 216.8 217.7 (0.9)
Depreciation 148.4 136.5 126.2 107.0 19.2
Amortization of customer lists and
favorable lease commitments 72.2 72.3 59.6 59.6 —
EBITDA $ 687.0(1) $ 685.6(2) $ 514.8 $ 425.3 $ 89.5(3)
EBITDA rate 14.9%15.6%12.8%
(1) For fiscal year 2008, operating earnings and EBITDA include other income, net consisting of 1) $32.5 million of other
income related to a one-time pension curtailment gain as a result of our decision to freeze certain Pension and SERP benefits
as of December 31, 2007, offset by 2) $31.3 million pretax impairment charge related to the writedown to fair value of the
net carrying value of the Horchow tradename.
(2) For fiscal year 2007, operating earnings and EBITDA include other expense, net consisting of 1) $11.5 million pretax
impairment charge related to the writedown to fair value of the net carrying value of the Horchow tradename, offset by 2)
$4.2 million of other income we received in connection with the merger of Wedding Channel.com, in which we held a
minority interest, and The Knot and 3) $6.0M of other income related to aged, non-escheatable gift cards.
(3) For the nine weeks ended October 1, 2005, operating earnings and EBITDA include other expense, net consisting of
$23.5 million of transaction and other costs incurred in connection with the Acquisition. These costs consist primarily
36