NVIDIA 2003 Annual Report Download - page 69
Download and view the complete annual report
Please find page 69 of the 2003 NVIDIA annual report below. You can navigate through the pages in the report by either clicking on the pages listed below, or by using the keyword search tool below to find specific information within the annual report.-
 1
1 -
2
-
3
-
4
-
5
-
6
-
7
-
8
-
9
-
10
-
11
-
12
-
13
-
14
-
15
-
16
-
17
-
18
-
19
-
20
-
21
-
22
-
23
-
24
-
25
-
26
-
27
-
28
-
29
-
30
-
31
-
32
-
33
-
34
-
35
-
36
-
37
-
38
-
39
-
40
-
41
-
42
-
43
-
44
-
45
-
46
-
47
-
48
-
49
-
50
-
51
-
52
-
53
-
54
-
55
-
56
-
57
-
58
-
 59
59 -
 60
60 -
 61
61 -
 62
62 -
 63
63 -
 64
64 -
 65
65 -
 66
66 -
 67
67 -
 68
68 -
 69
69 -
 70
70 -
 71
71 -
 72
72 -
 73
73 -
 74
74 -
 75
75 -
 76
76 -
 77
77 -
 78
78 -
 79
79
 |
 |

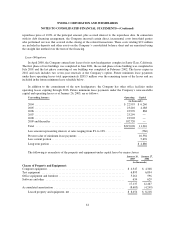
NVIDIA CORPORATION AND SUBSIDIARIES
NOTES TO CONSOLIDATED FINANCIAL STATEMENTS—(Continued)
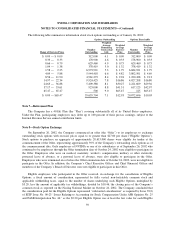
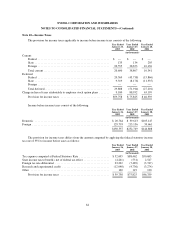
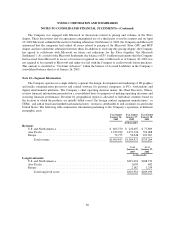
Revenue from significant customers, those representing approximately 10% or more of total revenue for the
respective periods, is summarized as follows:
Year Ended
January 26,
2003
Year Ended
January 27,
2002
Year Ended
January 28,
2001
Revenue:
Customer A .............................................. 15% 14% 4%
Customer B .............................................. 23% 9% —
Customer C .............................................. 9% 10% 5%
Customer D .............................................. 17% 20% 25%
Customer E ............................................... 1% 7% 10%
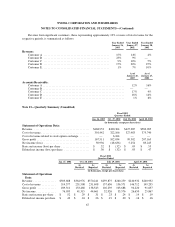
As of
January 26,
2003
As of
January 27,
2002
Accounts Receivable:
Customer A ......................................................... 12% 16%
Customer B ......................................................... — —
Customer C ......................................................... 17% 9%
Customer D ......................................................... 18% 14%
Customer E ......................................................... 1% 6%
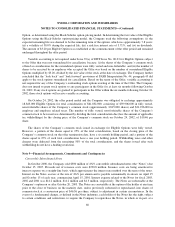
Note 13—Quarterly Summary (Unaudited)
Fiscal 2003
Quarters Ended
Jan. 26, 2003 Oct. 27, 2002 July 28, 2002 April 28, 2002
(in thousands, except per share data)
Statement of Operations Data:
Revenue ....................................... $468,953 $430,304 $427,285 $582,905
Cost of revenue .................................. 301,442 322,106 327,983 375,740
Cost of revenue related to stock option exchange ....... — 6,164 — —
Gross profit ..................................... 167,511 102,034 99,302 207,165
Net income (loss) ................................ 50,936 (48,636) 5,254 83,245
Basic net income (loss) per share .................... $ .32 $ (.32) $ .03 $ .55
Diluted net income (loss) per share .................. $ .30 $ (.32) $ .03 $ .47
Fiscal 2002
Quarters Ended
Jan. 27, 2002 Oct. 28, 2001 July 29, 2001 April 29, 2001
As
Restated
As
Reported
As
Restated
As
Reported
As
Restated
As
Reported
(in thousands, except per share data)
Statement of Operations
Data:
Revenue ................ $503,688 $364,976 $370,241 $259,875 $260,259 $240,932 $240,932
Cost of revenue .......... 314,377 231,508 231,698 157,636 156,571 146,712 149,295
Gross profit ............. 189,311 133,468 138,543 102,239 103,688 94,220 91,637
Net income .............. 76,033 41,315 44,661 32,926 33,576 26,650 25,867
Basic net income per share . $ .52 $ .29 $ .31 $ .23 $ .24 $ .19 $ .19
Diluted net income per share $ .43 $ .24 $ .26 $ .19 $ .20 $ .16 $ .16
67