NVIDIA 2003 Annual Report Download - page 18
Download and view the complete annual report
Please find page 18 of the 2003 NVIDIA annual report below. You can navigate through the pages in the report by either clicking on the pages listed below, or by using the keyword search tool below to find specific information within the annual report.-
 1
1 -
2
-
3
-
4
-
5
-
6
-
7
-
 8
8 -
 9
9 -
 10
10 -
 11
11 -
 12
12 -
 13
13 -
 14
14 -
 15
15 -
 16
16 -
 17
17 -
 18
18 -
 19
19 -
 20
20 -
 21
21 -
 22
22 -
 23
23 -
 24
24 -
 25
25 -
 26
26 -
 27
27 -
 28
28 -
29
-
30
-
31
-
32
-
33
-
34
-
35
-
36
-
37
-
38
-
39
-
40
-
41
-
42
-
43
-
44
-
45
-
46
-
47
-
48
-
49
-
50
-
51
-
52
-
53
-
54
-
55
-
56
-
57
-
58
-
59
-
60
-
61
-
62
-
63
-
64
-
65
-
66
-
67
-
68
-
69
-
70
-
71
-
72
-
73
-
74
-
75
-
76
-
77
-
78
-
79
 |
 |

• The third area related to past accounting judgments that, upon review, we concluded were incorrect, but
we did not reach a conclusion whether they were made in good faith or bad faith.
• The fourth category related to waived audit adjustments for prior periods, which were items previously
identified as part of the normal quarterly review and annual audit process, but for which we had
concluded we were not required to make adjusting entries in order to prepare our financial statements
under generally accepted accounting principles.
For additional information on the restatement, refer to Note 13 of the Notes to Consolidated Financial
Statements.
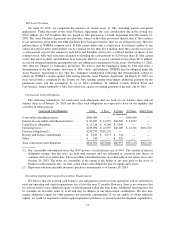
Results of Operations
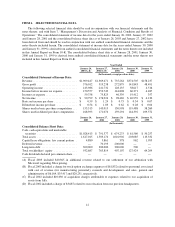
The following table sets forth, for the periods indicated, certain items in our consolidated statements of
income expressed as a percentage of revenue.
Year Ended
January 26,
2003
January 27,
2002
January 28,
2001
Revenue ..................................................... 100.0% 100.0% 100.0%
Cost of revenue ................................................ 69.5 62.1 62.9
Cost of revenue related to stock option exchange ..................... 0.3 — —
Gross profit ................................................... 30.2 37.9 37.1
Operating expenses:
Research and development ................................... 11.8 11.3 11.7
Sales, general and administrative .............................. 7.9 7.2 8.0
Stock option exchange ...................................... 2.9 — —
Amortization of goodwill .................................... 0.0 0.7 —
Acquisition related charges ................................... 0.0 0.7 —
Discontinued use of property ................................. 0.0 0.3 —
Total operating expenses ................................ 22.6 20.2 19.7
Operating income ...................................... 7.6 17.7 17.4
Interest and other income, net ..................................... 0.3 0.8 2.3
Income before income tax expense ................................. 7.9 18.5 19.7
Income tax expense ............................................. 3.1 5.5 6.3
Net income ........................................... 4.8% 13.0% 13.4%
Fiscal Years Ended January 26, 2003, January 27, 2002, and January 28, 2001
Revenue
Revenue was $1.91 billion in fiscal 2003, $1.37 billion in fiscal 2002, and $735.3 million in fiscal 2001,
which represented an increase of 39% from fiscal 2002 to 2003 and 86% from fiscal 2001 to 2002. The growth
was primarily the result of increased sales of our graphics processors driven by significant shipments of Xbox
processors in addition to the strong overall demand for our products in the workstation, mobile and platform
processor product lines.
Revenue from sales to customers outside of the United States and North America accounted for 68% and
82% of total revenue for fiscal 2003 and 2002, respectively. Revenue by geographical region is allocated to
individual countries based on the location to which the products are initially billed even if the foreign CEMs’ and
add-in board and motherboard manufacturers’ revenue is attributable to end customers located in the
United States. The decrease in the percentage of revenue from sales to customers outside of the United States is
primarily attributable to increased sales of the graphics and media communication processors used in the
Microsoft Xbox product billed to Microsoft in the United States.
16