NVIDIA 2003 Annual Report Download - page 45
Download and view the complete annual report
Please find page 45 of the 2003 NVIDIA annual report below. You can navigate through the pages in the report by either clicking on the pages listed below, or by using the keyword search tool below to find specific information within the annual report.-
 1
1 -
2
-
3
-
4
-
5
-
6
-
7
-
8
-
9
-
10
-
11
-
12
-
13
-
14
-
15
-
16
-
17
-
18
-
19
-
20
-
21
-
22
-
23
-
24
-
25
-
26
-
27
-
28
-
29
-
30
-
31
-
32
-
33
-
34
-
 35
35 -
 36
36 -
 37
37 -
 38
38 -
 39
39 -
 40
40 -
 41
41 -
 42
42 -
 43
43 -
 44
44 -
 45
45 -
 46
46 -
 47
47 -
 48
48 -
 49
49 -
 50
50 -
 51
51 -
 52
52 -
 53
53 -
 54
54 -
 55
55 -
56
-
57
-
58
-
59
-
60
-
61
-
62
-
63
-
64
-
65
-
66
-
67
-
68
-
69
-
70
-
71
-
72
-
73
-
74
-
75
-
76
-
77
-
78
-
79
 |
 |

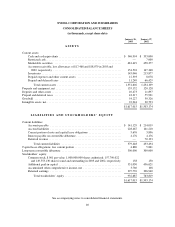
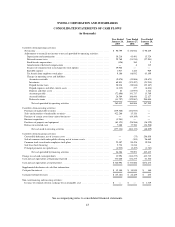
NVIDIA CORPORATION AND SUBSIDIARIES
CONSOLIDATED STATEMENTS OF CASH FLOWS
(in thousands)
Year Ended
January 26,
2003
Year Ended
January 27,
2002
Year Ended
January 28,
2001
Cash flows from operating activities:
Net income ................................................................ $ 90,799 $ 176,924 $ 98,469
Adjustments to reconcile net income to net cash provided by operating activities:
Depreciation and amortization ............................................... 58,216 43,491 15,724
Deferred income taxes ..................................................... 29,768 (51,914) (27,201)
Stock-based compensation .................................................. (156) 364 5
Amortization of deferred compensation ........................................ — 6 112
Issuance of common stock in exchange for stock options .......................... 39,906 — —
Bad debt expense ......................................................... 1,917 1,446 909
Tax benefit from employee stock plans ........................................ 9,180 88,932 63,199
Changes in operating assets and liabilities:
Accounts receivable ..................................................... (9,070) (43,806) (38,673)
Inventories ............................................................ 68,831 (123,497) (51,914)
Prepaid income taxes .................................................... 38,016 (38,016) (23,167)
Prepaid expenses and other current assets .................................... (4,315) 277 (6,814)
Deposits and other assets ................................................. 63 (13,957) 1,344
Accounts payable ....................................................... (72,890) 141,717 13,789
Accrued liabilities ...................................................... 26,564 108,646 22,127
Deferred revenue ....................................................... (11,797) (129,807) 200,000
Net cash provided by operating activities .................................. 265,032 160,806 267,909
Cash flows from investing activities:
Purchases of marketable securities .............................................. (639,500) (472,917) —
Sales and maturities of marketable securities ...................................... 422,200 15,320 —
Purchase of certain assets from various businesses ................................. — (64,109) —
Business acquisition ......................................................... (3,901) — —
Purchases of property and equipment ........................................... (63,123) (96,966) (36,329)
Release of restricted cash ..................................................... 7,000 17,500 (24,500)
Net cash used in investing activities ...................................... (277,324) (601,172) (60,829)
Cash flows from financing activities:
Convertible debenture, net of issuance costs ...................................... — (75) 290,838
Sale of common stock under public offering, net of issuance costs ..................... — (101) 96,669
Common stock issued under employee stock plans ................................. 25,487 90,476 19,910
Sale lease back financing ..................................................... 5,734 11,246 —
Principal payments on capital leases ............................................ (4,935) (2,455) (1,782)
Net cash provided by financing activities .................................. 26,286 99,091 405,635
Change in cash and cash equivalents .............................................. 13,994 (341,275) 612,715
Cash and cash equivalents at beginning of period .................................... 333,000 674,275 61,560
Cash and cash equivalents at end of period ......................................... $346,994 $ 333,000 $674,275
Supplemental disclosures of cash flow information:
Cash paid for interest .......................................................... $ 15,100 $ 14,830 $ 160
Cash paid (refund) for taxes ..................................................... $ (35,101) $ 26,429 $ 235
Non cash financing and investing activities:
Issuance of common stock in exchange for an intangible asset ........................ $ — $ — $ 1,319
See accompanying notes to consolidated financial statements.
43