NVIDIA 2003 Annual Report Download - page 53
Download and view the complete annual report
Please find page 53 of the 2003 NVIDIA annual report below. You can navigate through the pages in the report by either clicking on the pages listed below, or by using the keyword search tool below to find specific information within the annual report.-
 1
1 -
2
-
3
-
4
-
5
-
6
-
7
-
8
-
9
-
10
-
11
-
12
-
13
-
14
-
15
-
16
-
17
-
18
-
19
-
20
-
21
-
22
-
23
-
24
-
25
-
26
-
27
-
28
-
29
-
30
-
31
-
32
-
33
-
34
-
35
-
36
-
37
-
38
-
39
-
40
-
41
-
42
-
 43
43 -
 44
44 -
 45
45 -
 46
46 -
 47
47 -
 48
48 -
 49
49 -
 50
50 -
 51
51 -
 52
52 -
 53
53 -
 54
54 -
 55
55 -
 56
56 -
 57
57 -
 58
58 -
 59
59 -
 60
60 -
 61
61 -
 62
62 -
 63
63 -
64
-
65
-
66
-
67
-
68
-
69
-
70
-
71
-
72
-
73
-
74
-
75
-
76
-
77
-
78
-
79
 |
 |

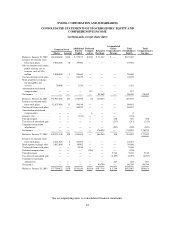
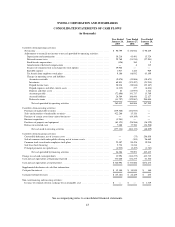
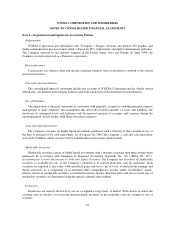
NVIDIA CORPORATION AND SUBSIDIARIES
NOTES TO CONSOLIDATED FINANCIAL STATEMENTS—(Continued)
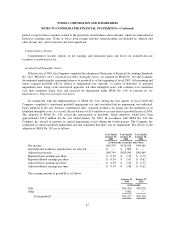
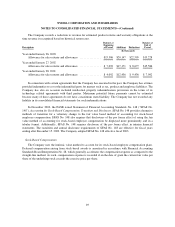
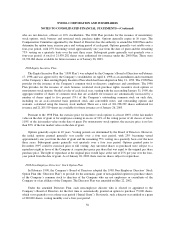
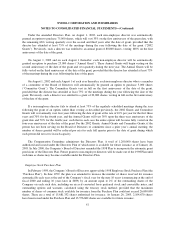
For the purpose of the pro forma calculation, the fair value of options granted under the Company’s stock
option plans has been estimated at the date of grant using the Black-Scholes option pricing model with the
following assumptions:
Year Ended
January 26,
2003
Year Ended
January 27,
2002
Year Ended
January 28,
2001
Weighted average expected life (in years) ................... 4 4 4
Risk free interest rate ................................... 3.8% 4.3% 5.7%
Volatility ............................................ 88% 83% 85%
Dividend yield ........................................ — — —
For the purpose of the pro forma calculation, the weighted-average per share fair value of options granted
during the years ended January 26, 2003, January 27, 2002 and January 28, 2001 was approximately $28.09,
$23.94 and $13.02, respectively.
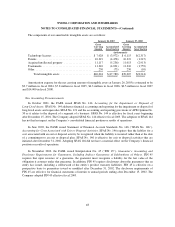
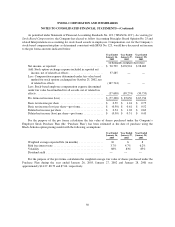
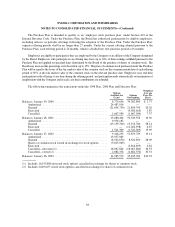
Net Income Per Share
Basic net income per share is computed using the weighted average number of common shares outstanding
during the period. Diluted net income per share is computed using the weighted average number of common and
dilutive common equivalent shares outstanding during the period, using the as-if-converted method for the
convertible debentures and the treasury stock method for stock options. Under the as-if-converted method and the
treasury stock method, the convertible debentures and the effect of stock options outstanding, respectively, are
not included in the computation of diluted net income per share for periods when their effect is anti-dilutive. The
following is a reconciliation of the numerators and denominators of the basic and diluted net income per share
computations for the periods presented.
Year Ended
January 26,
2003
Year Ended
January 27,
2002
Year Ended
January 28,
2001
(in thousands, except per share data)
Numerator:
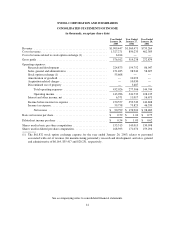
Numerator for basic net income per share ....................... $ 90,799 $176,924 $ 98,469
Numerator for diluted net income per share ..................... $ 90,799 $176,924 $ 98,469
Denominator:
Denominator for basic net income per share, weighted average shares 153,513 143,015 130,998
Effect of dilutive securities:
Stock options outstanding ................................... 14,880 28,059 28,296
Denominator for diluted net income per share, weighted average
shares ................................................. 168,393 171,074 159,294
Net income per share:
Basic net income per share .................................. $ 0.59 $ 1.24 $ 0.75
Diluted net income per share ................................. $ 0.54 $ 1.03 $ 0.62
51