JVC 2003 Annual Report Download - page 55
Download and view the complete annual report
Please find page 55 of the 2003 JVC annual report below. You can navigate through the pages in the report by either clicking on the pages listed below, or by using the keyword search tool below to find specific information within the annual report.-
 1
1 -
2
-
3
-
4
-
5
-
6
-
7
-
8
-
9
-
10
-
11
-
12
-
13
-
14
-
15
-
16
-
17
-
18
-
19
-
20
-
21
-
22
-
23
-
24
-
25
-
26
-
27
-
28
-
29
-
30
-
31
-
32
-
33
-
34
-
35
-
36
-
37
-
38
-
39
-
40
-
41
-
42
-
43
-
44
-
 45
45 -
 46
46 -
 47
47 -
 48
48 -
 49
49 -
 50
50 -
 51
51 -
 52
52 -
 53
53 -
 54
54 -
 55
55 -
 56
56 -
 57
57 -
 58
58
 |
 |

Victor Company of Japan, Limited
Annual Report 2003 53
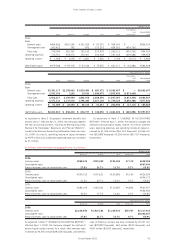
Millions of yen
Elimination
and Consolidated
Japan Americas Europe Asia Total unallocation total
2001:
Sales
External sales ¥454,626 ¥261,185 ¥151,269 ¥ 67,270 ¥ 934,350 ¥ — ¥934,350
Intersegment sales 263,473 182 873 170,233 434,761 (434,761) —
Total sales 718,099 261,367 152,142 237,503 1,369,111 (434,761) 934,350
Operating expenses 716,531 258,272 150,301 236,238 1,361,342 (432,684) 928,658
Operating income ¥ 1,568 ¥ 3,095 ¥ 1,841 ¥ 1,265 ¥ 7,769 ¥ (2,077) ¥ 5,692
Identifiable assets ¥379,008 ¥ 99,105 ¥ 67,343 ¥ 75,655 ¥ 621,111 ¥ (34,483) ¥586,628
Thousands of U.S. dollars
Elimination
and Consolidated
Japan Americas Europe Asia Total unallocation total
2003:
Sales
External sales $3,381,117 $2,158,692 $1,836,483 $ 687,375 $ 8,063,667 $ — $8,063,667
Intersegment sales 2,181,100 1,292 10,033 1,680,975 3,873,400 (3,873,400) —
Total sales 5,562,217 2,159,984 1,846,516 2,368,350 11,937,067 (3,873,400) 8,063,667
Operating expenses 5,471,133 2,137,500 1,798,383 2,327,109 11,734,125 (3,856,283) 7,877,842
Operating income $ 91,084 $ 22,484 $ 48,133 $ 41,241 $ 202,942 $ (17,117) $ 185,825
Identifiable assets $2,641,833 $ 656,400 $ 636,717 $ 726,050 $ 4,661,000 $ (663,083) $3,997,917
As explained in Note 2 “Employees’ retirement benefits and
pension plans”, effective April 1, 2000, the Company adopted
the new accounting standard, “Opinion on Setting Accounting
Standard for Employees’ Severance and Pension Benefits”,
issued by the Business Accounting Deliberation Council on June
16, 1998. As a result, operating income of Japan decreased
by ¥555 million and unallocated operating expenses increased
by ¥1 million.
As explained in Note 3 “CHANGE IN ACCOUNTING
METHOD”, effective April 1, 2002, the Company changed the
method of accounting for royalty income. As a result, external
sales, operating expenses and operating income of Japan in-
creased by ¥7,356 million ($61,300 thousand), ¥4,066 mil-
lion ($33,883 thousand), ¥3,290 million ($27,417 thousand),
respectively.
As explained in Note 3 “CHANGE IN ACCOUNTING METHOD”,
effective April 1, 2002, the Company changed the method of
accounting for royalty income. As a result, total overseas sales
increased by ¥3,365 million ($28,042 thousand), and overseas
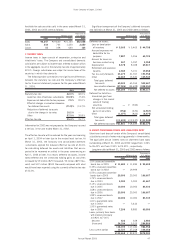
3) Overseas sales information by geographic area is as follows:
Millions of yen
Americas Europe Asia Other area Total
2003:
Overseas sales ¥268,674 ¥229,222 ¥133,024 ¥7,172 ¥638,092
Consolidated sales ¥967,640
Ratio of overseas sales to consolidated sales 27.8% 23.7% 13.7% 0.7% 65.9%
2002:
Overseas sales ¥299,512 ¥197,621 ¥123,883 ¥5,193 ¥626,209
Consolidated sales ¥954,172
Ratio of overseas sales to consolidated sales 31.4% 20.7% 13.0% 0.5% 65.6%
2001:
Overseas sales ¥284,165 ¥163,521 ¥115,487 ¥4,804 ¥567,977
Consolidated sales ¥934,350
Ratio of overseas sales to consolidated sales 30.4% 17.5% 12.4% 0.5% 60.8%
Thousands of U.S. dollars
Americas Europe Asia Other area Total
2003:
Overseas sales $2,238,950 $1,910,183 $1,108,533 $59,767 $5,317,433
Consolidated sales $8,063,667
Ratio of overseas sales to consolidated sales 27.8% 23.7% 13.7% 0.7% 65.9%
sales of Americas, Europe and Asia increased by ¥2,741 mil-
lion ($22,842 thousand), ¥69 million ($575 thousand), and
¥555 million ($4,625 thousand), respectively.