JVC 2003 Annual Report Download - page 35
Download and view the complete annual report
Please find page 35 of the 2003 JVC annual report below. You can navigate through the pages in the report by either clicking on the pages listed below, or by using the keyword search tool below to find specific information within the annual report.-
 1
1 -
2
-
3
-
4
-
5
-
6
-
7
-
8
-
9
-
10
-
11
-
12
-
13
-
14
-
15
-
16
-
17
-
18
-
19
-
20
-
21
-
22
-
23
-
24
-
 25
25 -
 26
26 -
 27
27 -
 28
28 -
 29
29 -
 30
30 -
 31
31 -
 32
32 -
 33
33 -
 34
34 -
 35
35 -
 36
36 -
 37
37 -
 38
38 -
 39
39 -
 40
40 -
 41
41 -
 42
42 -
 43
43 -
 44
44 -
 45
45 -
46
-
47
-
48
-
49
-
50
-
51
-
52
-
53
-
54
-
55
-
56
-
57
-
58
 |
 |

Victor Company of Japan, Limited
Annual Report 2003 33
Overview
During fiscal 2003, ended March 31,
2003, full-scale recovery in the US was
stalled by a number of high-profile
business failures and weaker consumer
spending. This combined with the im-
pact of the war in Iraq to cloud the U.S.
in uncertainty. Although there was evi-
dence of a mild recovery in Europe, the
economy lost momentum from the
summer of 2002, with the slowdown
in Germany most prominent. In Japan,
the economy remained mired in a
slump with no signs of a recovery as
stock prices plummeted and consumer
spending deteriorated.
Net Sales
Net sales rose 1.4%, or ¥13.5 billion,
to ¥967.6 billion. By geographic seg-
ment, sales in Japan were held to a
2.0% increase at ¥405.7 billion, pri-
marily due to anemic consumer spend-
ing and falling prices. This outweighed
an upturn in demand related to the
2002 FIFA World CupTM Korea/Japan.
In the U.S., stronger sales of televisions,
car AV systems and video recorders
failed to offset the effects of weaken-
ing consumer sentiment and a slow-
down in the economy in the latter half
of the year. As a result, sales in the
U.S. dropped 8.4% to ¥259.0 billion.
In Europe, sales of DVD players sold
as individual units and as part of digital
theater systems, broke through the one
million-unit barrier. This combined with
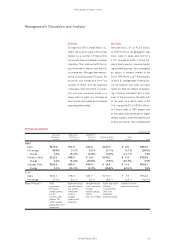
Management’s Discussion and Analysis
Net Sales by Segment
Billions of yen
Consumer Professional Components
electronics electronics & Devices Software & Media Other
business business business business business Total
2003
Sales ¥675.0 ¥71.0 ¥47.6 ¥167.5 ¥ 6.5 ¥967.6
Percentage 69.8% 7.3 % 4.9 % 17.3 % 0.7 % 100.0%
Change 5.3% (9.3)% (4.2)% (5.4)% 17.7 % 1.4%
Domestic Sales ¥122.1 ¥48.5 ¥ 3.6 ¥149.1 ¥ 6.2 ¥329.5
Change 6.2% (6.4)% (20.0)% (0.3)% (12.7)% 0.5%
Overseas Sales ¥552.9 ¥22.5 ¥44.0 ¥ 18.4 ¥ 0.3 ¥638.1
Change 5.1% (15.1)% (2.7)% (32.8)% 62.5 % 1.9%
2002
Sales ¥641.3 ¥78.3 ¥49.7 ¥177.0 ¥ 7.9 ¥954.2
Percentage 67.2% 8.2 % 5.2 % 18.6 % 0.8 % 100.0%
Major Products VCRs, Professional-use Components for Audio and visual Interior furniture
camcorders, and educational- use in computer software production facilities
televisions, use systems, displays, including CDs,
stereo systems, information optical pickups, DVDs and
car AV systems, motors videotapes
systems, DVD karaoke and “VIL” PWBs recording media
players, CD systems and
radio cassette projectors
tape players and
telephones