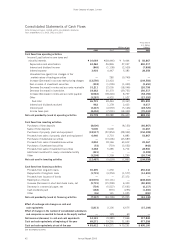
JVC 2003 Annual Report Download - page 40
Download and view the complete annual report
Please find page 40 of the 2003 JVC annual report below. You can navigate through the pages in the report by either clicking on the pages listed below, or by using the keyword search tool below to find specific information within the annual report.-
 1
1 -
2
-
3
-
4
-
5
-
6
-
7
-
8
-
9
-
10
-
11
-
12
-
13
-
14
-
15
-
16
-
17
-
18
-
19
-
20
-
21
-
22
-
23
-
24
-
25
-
26
-
27
-
28
-
29
-
 30
30 -
 31
31 -
 32
32 -
 33
33 -
 34
34 -
 35
35 -
 36
36 -
 37
37 -
 38
38 -
 39
39 -
 40
40 -
 41
41 -
 42
42 -
 43
43 -
 44
44 -
 45
45 -
 46
46 -
 47
47 -
 48
48 -
 49
49 -
 50
50 -
51
-
52
-
53
-
54
-
55
-
56
-
57
-
58
 |
 |
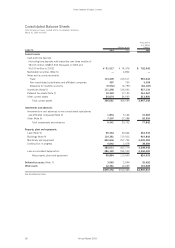
Victor Company of Japan, Limited
38 Annual Report 2003
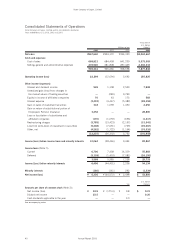
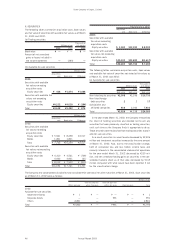
Consolidated Balance Sheets
Victor Company of Japan, Limited and its consolidated subsidiaries
March 31, 2003 and 2002
Thousands of
U.S. dollars
Millions of yen (Note 1)
ASSETS 2003 2002 2003
Current assets:
Cash and time deposits
(including time deposits with maturities over three months of
¥8,105 million (US$67,542 thousand) in 2003 and
¥5,105 million in 2002) ¥ 91,517 ¥ 74,376 $ 762,642
Marketable securities (Note 6) —2,802 —
Notes and accounts receivable:
Trade 113,405 125,617 945,042
Non-consolidated subsidiaries and affiliated companies 397 735 3,308
Allowance for doubtful accounts (5,532) (4,797) (46,100)
Inventories (Note 5) 111,256 126,063 927,133
Deferred tax assets (Note 7) 19,364 17,143 161,367
Other current assets 25,674 24,660 213,950
Total current assets 356,081 366,599 2,967,342
Investments and advances:
Investments in and advances to non-consolidated subsidiaries
and affiliated companies (Note 6) 1,834 3,164 15,283
Other (Note 6) 7,507 17,588 62,559
Total investments and advances 9,341 20,752 77,842
Property, plant and equipment:
Land (Note 9) 29,344 30,044 244,533
Buildings (Note 9) 110,381 113,913 919,842
Machinery and equipment 240,646 257,744 2,005,383
Construction in progress 4,642 3,478 38,684
385,013 405,179 3,208,442
Less accumulated depreciation 286,129 294,530 2,384,409
Net property, plant and equipment 98,884 110,649 824,033
Deferred tax assets (Note 7) 3,083 2,696 25,692
Other assets 12,361 12,669 103,008
¥479,750 ¥513,365 $3,997,917
See accompanying notes.