JVC 2003 Annual Report Download - page 54
Download and view the complete annual report
Please find page 54 of the 2003 JVC annual report below. You can navigate through the pages in the report by either clicking on the pages listed below, or by using the keyword search tool below to find specific information within the annual report.-
 1
1 -
2
-
3
-
4
-
5
-
6
-
7
-
8
-
9
-
10
-
11
-
12
-
13
-
14
-
15
-
16
-
17
-
18
-
19
-
20
-
21
-
22
-
23
-
24
-
25
-
26
-
27
-
28
-
29
-
30
-
31
-
32
-
33
-
34
-
35
-
36
-
37
-
38
-
39
-
40
-
41
-
42
-
43
-
 44
44 -
 45
45 -
 46
46 -
 47
47 -
 48
48 -
 49
49 -
 50
50 -
 51
51 -
 52
52 -
 53
53 -
 54
54 -
 55
55 -
 56
56 -
 57
57 -
 58
58
 |
 |

Victor Company of Japan, Limited
52 Annual Report 2003
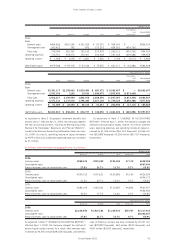
Thousands of U.S.dollars
Consumer Professional Components Software Eliminations
electronics electronics & Devices & Media Other and Consolidated
business business business business business Total unallocation total
2003:
Sales
External sales $5,624,750 $591,275 $396,467 $1,396,042 $ 55,133 $8,063,667 $ — $8,063,667
Intersegment sales 22,683 34,508 16,692 59,942 29,267 163,092 (163,092) —
Total sales 5,647,433 625,783 413,159 1,455,984 84,400 8,226,759 (163,092) 8,063,667
Operating expenses 5,436,733 656,591 419,100 1,445,208 74,593 8,032,225 (154,383) 7,877,842
Operating income
(loss) $ 210,700 $ (30,808) $ (5,941) $ 10,776 $ 9,807 $ 194,534 $ (8,709) $ 185,825
Identifiable assets $2,048,283 $368,892 $247,725 $ 789,958 $172,434 $3,627,292 $370,625 $3,997,917
Depreciation &
amortization 115,917 13,708 37,008 36,033 5,326 207,992 2,425 210,417
Capital expenditures 105,992 12,633 39,558 13,592 2,058 173,833 1,467 175,300
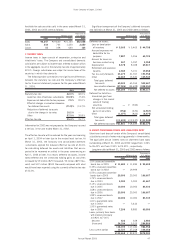
As explained in Note 2 “Employees’ retirement benefits and
pension plans”, effective April 1, 2000, the Company adopted
the new accounting standard, “Opinion on Setting Accounting
Standard for Employees’ Severance and Pension Benefits”,
issued by the Business Accounting Deliberation Council on June
16, 1998. As a result, operating income of Consumer electron-
ics business decreased by ¥235 million, operating loss of Pro-
fessional electronics business increased by ¥83 million,
operating income of Components & Devices business decreased
by ¥70 million, operating income of Entertainment Software &
Media business decreased by ¥145 million, operating loss of
Other business increased by ¥20 million and unallocated oper-
ating expenses increased by ¥1 million.
As explained in Note 3 “CHANGE IN ACCOUNTING
METHOD”, effective April 1, 2002, the Company changed the
method of accounting for royalty income. As a result, external
sales, operating expenses and operating income of Consumer
electronics business increased by ¥7,356 million ($61,300
thousand), ¥4,066 million ($33,883 thousand), ¥3,290 mil-
lion ($27,417 thousand), respectively.
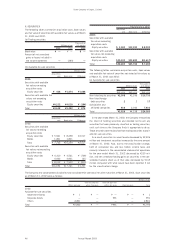
2) Geographical segment information is as follows:
Millions of yen
Elimination
and Consolidated
Japan Americas Europe Asia Total unallocation total
2003:
Sales
External sales ¥405,734 ¥259,043 ¥220,378 ¥ 82,485 ¥ 967,640 ¥ — ¥967,640
Intersegment sales 261,732 155 1,204 201,717 464,808 (464,808) —
Total sales 667,466 259,198 221,582 284,202 1,432,448 (464,808) 967,640
Operating expenses 656,536 256,500 215,806 279,253 1,408,095 (462,754) 945,341
Operating income ¥ 10,930 ¥ 2,698 ¥ 5,776 ¥ 4,949 ¥ 24,353 ¥ (2,054) ¥ 22,299
Identifiable assets ¥317,020 ¥ 78,768 ¥ 76,406 ¥ 87,126 ¥ 559,320 ¥ (79,570) ¥479,750
Millions of yen
Elimination
and Consolidated
Japan Americas Europe Asia Total unallocation total
2002:
Sales
External sales ¥397,635 ¥282,828 ¥191,591 ¥ 82,118 ¥ 954,172 ¥ — ¥954,172
Intersegment sales 246,654 248 1,036 166,361 414,299 (414,299) —
Total sales 644,289 283,076 192,627 248,479 1,368,471 (414,299) 954,172
Operating expenses 663,129 280,245 188,945 244,906 1,377,225 (410,959) 966,266
Operating income (loss) ¥ (18,840) ¥ 2,831 ¥ 3,682 ¥ 3,573 ¥ (8,754) ¥ (3,340) ¥ (12,094)
Identifiable assets ¥338,843 ¥ 93,275 ¥ 72,262 ¥ 75,958 ¥ 580,338 ¥ (66,973) ¥513,365