JVC 2003 Annual Report Download - page 53
Download and view the complete annual report
Please find page 53 of the 2003 JVC annual report below. You can navigate through the pages in the report by either clicking on the pages listed below, or by using the keyword search tool below to find specific information within the annual report.-
 1
1 -
2
-
3
-
4
-
5
-
6
-
7
-
8
-
9
-
10
-
11
-
12
-
13
-
14
-
15
-
16
-
17
-
18
-
19
-
20
-
21
-
22
-
23
-
24
-
25
-
26
-
27
-
28
-
29
-
30
-
31
-
32
-
33
-
34
-
35
-
36
-
37
-
38
-
39
-
40
-
41
-
42
-
 43
43 -
 44
44 -
 45
45 -
 46
46 -
 47
47 -
 48
48 -
 49
49 -
 50
50 -
 51
51 -
 52
52 -
 53
53 -
 54
54 -
 55
55 -
 56
56 -
 57
57 -
 58
58
 |
 |

Victor Company of Japan, Limited
Annual Report 2003 51
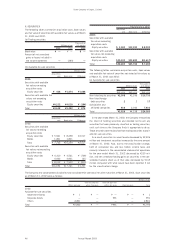
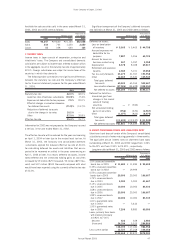
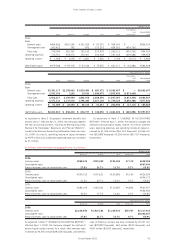
15. SEGMENT INFORMATION
Information by segment for the years ended March 31, 2003, 2002 and 2001 is shown in the tables below.
1) Business segment information is as follows:
Millions of yen
Consumer Professional Components Software Eliminations
electronics electronics & Devices & Media Other and Consolidated
business business business business business Total unallocation total
2003:
Sales
External sales ¥674,970 ¥70,953 ¥47,576 ¥167,525 ¥ 6,616 ¥967,640 ¥ — ¥967,640
Intersegment sales 2,722 4,141 2,003 7,193 3,512 19,571 (19,571) —
Total sales 677,692 75,094 49,579 174,718 10,128 987,211 (19,571) 967,640
Operating expenses 652,408 78,791 50,292 173,425 8,951 963,867 (18,526) 945,341
Operating income
(loss) ¥ 25,284 ¥ (3,697) ¥ (713) ¥ 1,293 ¥ 1,177 ¥ 23,344 ¥ (1,045) ¥ 22,299
Identifiable assets ¥245,794 ¥44,267 ¥29,727 ¥ 94,795 ¥20,692 ¥435,275 ¥ 44,475 ¥479,750
Depreciation &
amortization 13,910 1,645 4,441 4,324 639 24,959 291 25,250
Capital expenditures 12,719 1,516 4,747 1,631 247 20,860 176 21,036
Millions of yen
Consumer Professional Components Software Eliminations
electronics electronics & Devices & Media Other and Consolidated
business business business business business Total unallocation total
2002:
Sales
External sales ¥641,329 ¥78,344 ¥49,701 ¥177,004 ¥ 7,794 ¥954,172 ¥ — ¥954,172
Intersegment sales 2,802 4,412 2,432 9,555 3,552 22,753 (22,753) —
Total sales 644,131 82,756 52,133 186,559 11,346 976,925 (22,753) 954,172
Operating expenses 647,583 87,750 56,863 183,350 11,830 987,376 (21,110) 966,266
Operating income
(loss) ¥ (3,452) ¥ (4,994) ¥ (4,730) ¥ 3,209 ¥ (484) ¥ (10,451) ¥ (1,643) ¥ (12,094)
Identifiable assets ¥263,357 ¥46,418 ¥32,216 ¥114,121 ¥17,981 ¥474,093 ¥39,272 ¥513,365
Depreciation &
amortization 15,442 1,764 4,585 5,083 821 27,695 305 28,000
Capital expenditures 10,808 2,300 3,852 2,701 1,449 21,110 65 21,175
Millions of yen
Consumer Professional Components Software Eliminations
electronics electronics & Devices & Media Other and Consolidated
business business business business business Total unallocation total
2001:
Sales
External sales ¥598,636 ¥83,915 ¥61,544 ¥183,256 ¥ 6,999 ¥934,350 ¥ — ¥934,350
Intersegment sales 3,521 3,597 2,647 9,039 2,926 21,730 (21,730) —
Total sales 602,157 87,512 64,191 192,295 9,925 956,080 (21,730) 934,350
Operating expenses 598,991 92,416 60,056 187,837 10,296 949,596 (20,938) 928,658
Operating income
(loss) ¥ 3,166 ¥ (4,904) ¥ 4,135 ¥ 4,458 ¥ (371) ¥ 6,484 ¥ (792) ¥ 5,692
Identifiable assets ¥290,251 ¥50,002 ¥34,643 ¥119,123 ¥16,427 ¥510,446 ¥76,182 ¥586,628
Depreciation &
amortization 14,847 2,240 5,167 4,666 808 27,728 357 28,085
Capital expenditures 16,149 2,132 4,988 7,254 570 31,093 34 31,127