JVC 2003 Annual Report Download - page 48
Download and view the complete annual report
Please find page 48 of the 2003 JVC annual report below. You can navigate through the pages in the report by either clicking on the pages listed below, or by using the keyword search tool below to find specific information within the annual report.-
 1
1 -
2
-
3
-
4
-
5
-
6
-
7
-
8
-
9
-
10
-
11
-
12
-
13
-
14
-
15
-
16
-
17
-
18
-
19
-
20
-
21
-
22
-
23
-
24
-
25
-
26
-
27
-
28
-
29
-
30
-
31
-
32
-
33
-
34
-
35
-
36
-
37
-
 38
38 -
 39
39 -
 40
40 -
 41
41 -
 42
42 -
 43
43 -
 44
44 -
 45
45 -
 46
46 -
 47
47 -
 48
48 -
 49
49 -
 50
50 -
 51
51 -
 52
52 -
 53
53 -
 54
54 -
 55
55 -
 56
56 -
 57
57 -
 58
58
 |
 |

Victor Company of Japan, Limited
46 Annual Report 2003
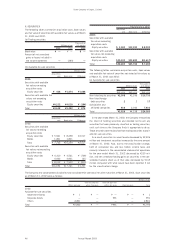
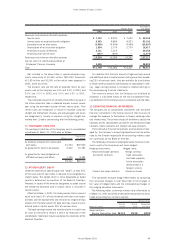
6. SECURITIES
The following tables summarize acquisition costs, book values
and fair value of securities with available fair values as of March
31, 2003 and 2002:
(a) Trading securities
Thousands of
Millions of yen U.S. dollars
2003 2002 2003
Book value ¥ — ¥ — $ —
Amount of net unrealized
gains or losses included in
the income statement —(280) —
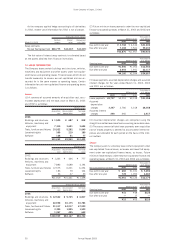
(b) Available-for-sale securities
Millions of yen
Acquisition
cost Book value Difference
2003:
Securities with available
fair values exceeding
acquisition costs
Equity securities ¥ 406 ¥1,474 ¥1,068
Securities with available fair
values not exceeding
acquisition costs
Equity securities ¥4,212 ¥4,018 ¥ (194)
Total ¥4,618 ¥5,492 ¥ 874
Millions of yen
Acquisition
cost Book value Difference
2002:
Securities with available
fair values exceeding
acquisition costs
Equity securities ¥ 5,941 ¥ 8,458 ¥2,517
Bonds 1,801 1,801 —
Total ¥ 7,742 ¥10,259 ¥2,517
Securities with available
fair values not exceeding
acquisition costs
Equity securities ¥ 4,310 ¥ 3,561 ¥ (749)
Bonds 4,002 3,941 (61)
Total ¥ 8,312 ¥ 7,502 ¥ (810)
Total ¥16,054 ¥17,761 ¥1,707
Thousands of U.S. dollars
Acquisition
cost Book value Difference
2003:
Securities with available
fair values exceeding
acquisition costs
Equity securities $ 3,383 $12,283 $ 8,900
Securities with available
fair values not exceeding
acquisition costs
Equity securities $35,100 $33,483 $(1,617)
Total $38,483 $45,766 $ 7,283
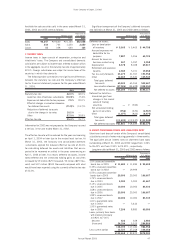
The following tables summarize acquisition costs, book values
and available fair value of securities not stated at fair values as
of March 31, 2003 and 2002:
(a) Available-for-sale securities
Thousands of
Millions of yen U.S. dollars
2003 2002 2003
Book value Book value Book value
Non-listed equity securities ¥2,008 ¥2,196 $16,733
Non-listed foreign
debt securities 2217
Subsidiaries and
affiliated companies 916 2,040 7,633
Total ¥2,926 ¥4,238 $24,383
In the year ended March 31, 2002, the Company re-examined
the intent of holding securities and decided not to sell any
securities that were previously classified as trading securities,
until such time as the Company finds it appropriate to do so.
Those securities were reclassified from trading securities to avail-
able-for-sale securities.
As a result, securities in current assets decreased by ¥2,426
million and investment securities increased by the same amount
at March 31, 2002. Also, due to the classification change,
both of unrealized loss and loss before income taxes and
minority interests in the consolidated statement of operations
for the year ended March 31, 2002 decreased by ¥230 mil-
lion, and net unrealized holding gains on securities in the con-
solidated balance sheet as of that date decreased by ¥145
million compared with what would have been reported if not
for the classification change.
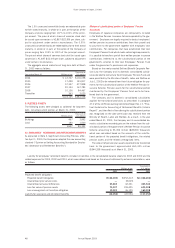
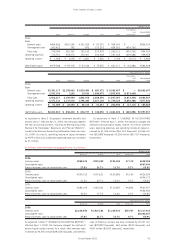
The Company and consolidated subsidiaries had no available-for-sale securities with maturities at March 31, 2003. Such securities
as of March 31, 2002 were as follows:
Millions of yen
Over one year but Over five years but
Within one year within five years within ten years Over ten years Total
2002:
Available-for-sale securities
Government bonds ¥ 1 ¥ — ¥ — ¥ — ¥ 1
Corporate bonds — — 991 — 991
Others 2,801 — — — 2,801
Total ¥2,802 ¥ — ¥991 ¥ — ¥3,793