JVC 2003 Annual Report Download - page 34
Download and view the complete annual report
Please find page 34 of the 2003 JVC annual report below. You can navigate through the pages in the report by either clicking on the pages listed below, or by using the keyword search tool below to find specific information within the annual report.-
 1
1 -
2
-
3
-
4
-
5
-
6
-
7
-
8
-
9
-
10
-
11
-
12
-
13
-
14
-
15
-
16
-
17
-
18
-
19
-
20
-
21
-
22
-
23
-
 24
24 -
 25
25 -
 26
26 -
 27
27 -
 28
28 -
 29
29 -
 30
30 -
 31
31 -
 32
32 -
 33
33 -
 34
34 -
 35
35 -
 36
36 -
 37
37 -
 38
38 -
 39
39 -
 40
40 -
 41
41 -
 42
42 -
 43
43 -
 44
44 -
45
-
46
-
47
-
48
-
49
-
50
-
51
-
52
-
53
-
54
-
55
-
56
-
57
-
58
 |
 |

Victor Company of Japan, Limited
32 Annual Report 2003
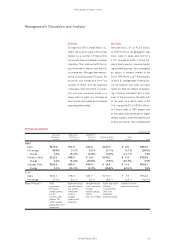
Five-Year Summary
Victor Company of Japan, Limited and its consolidated subsidiaries
Years ended March 31
Thousands of
U.S. dollars
Millions of yen (Note 1)
2003 2002 2001 2000 1999 2003
For the year:
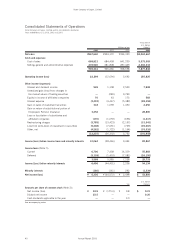
Net sales ¥967,640 ¥954,172 ¥934,350 ¥870,235 ¥946,617 $8,063,667
Overseas 638,092 626,209 567,977 545,316 566,551 5,317,433
Domestic 329,548 327,963 366,373 324,919 380,066 2,746,234
Cost of sales 668,821 684,458 641,209 600,506 642,140 5,573,509
Selling, general and
administrative expenses 276,520 281,808 287,449 277,748 305,698 2,304,333
Operating income (loss) 22,299 (12,094) 5,692 (8,019) (1,221) 185,825
Income (Loss) before income taxes
and minority interests 10,064 (38,446) 9,444 6,088 (3,671) 83,867
Income taxes 3,568 5,985 7,238 11,295 4,466 29,733
Net income (loss) 6,336 (44,572) 2,498 (5,341) (8,315) 52,800
Depreciation and amortization 25,250 28,000 28,085 28,590 30,513 210,417
Capital expenditures 21,036 21,175 31,127 24,336 28,815 175,300
R&D expenditures 40,973 40,981 44,094 43,351 41,660 341,442
Thousands of
U.S. dollars
Millions of yen (Note 1)
At year-end:
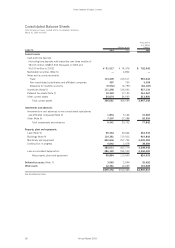
Working capital ¥149,172 ¥118,948 ¥150,067 ¥127,709 ¥142,628 $1,243,100
Stockholders’ equity 146,410 146,246 180,515 199,164 232,162 1,220,083
Total assets 479,750 513,365 586,628 540,359 588,001 3,997,917
U.S. dollars
Yen (Note 1)
Per share:
Net income (loss) (Note 2) ¥ 24.9 ¥ (175.3) ¥ 9.8 ¥ (21.0) ¥ (32.7) $ 0.21
Diluted net income (Note 2) 23.5 ———— 0.20
Cash dividends (Note 3) ——3.0 — 5.0 —
Notes: 1. U.S. dollar amounts have been translated, for convenience only, at the exchange rate of ¥120 to U.S.$1, the approximate rate prevailing on
March 31, 2003.
2. Net income (loss) per share of common stock for the years ended March 31, 2002 and 2001 have not been recalculated using the new
accounting standard, which is effective April 1, 2002.
3. Cash dividends represent amounts applicable to the respective years.