JVC 2003 Annual Report Download - page 49
Download and view the complete annual report
Please find page 49 of the 2003 JVC annual report below. You can navigate through the pages in the report by either clicking on the pages listed below, or by using the keyword search tool below to find specific information within the annual report.-
 1
1 -
2
-
3
-
4
-
5
-
6
-
7
-
8
-
9
-
10
-
11
-
12
-
13
-
14
-
15
-
16
-
17
-
18
-
19
-
20
-
21
-
22
-
23
-
24
-
25
-
26
-
27
-
28
-
29
-
30
-
31
-
32
-
33
-
34
-
35
-
36
-
37
-
38
-
 39
39 -
 40
40 -
 41
41 -
 42
42 -
 43
43 -
 44
44 -
 45
45 -
 46
46 -
 47
47 -
 48
48 -
 49
49 -
 50
50 -
 51
51 -
 52
52 -
 53
53 -
 54
54 -
 55
55 -
 56
56 -
 57
57 -
 58
58
 |
 |

Victor Company of Japan, Limited
Annual Report 2003 47
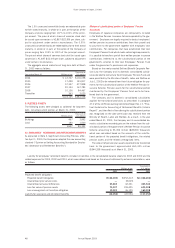
Available-for-sale securities sold in the years ended March 31,
2003, 2002 and 2001 were as follows:
Thousands of
Millions of yen U.S. dollars
2003 2002 2001 2003
Sales ¥6,247 ¥19,640 ¥16,160 $52,058
Gains 318 763 1,450 2,650
Losses 15 358 640 125
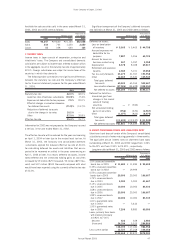
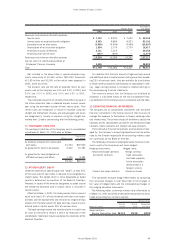
7. INCOME TAXES
Income taxes in Japan consist of corporation, enterprise and
inhabitants’ taxes. The Company and consolidated domestic
subsidiaries are subject to income taxes referred to above, which
in the aggregate, result in the statutory tax rate of approximately
42.0%. Foreign subsidiaries are subject to income taxes of the
countries in which they domicile.
The following table summarizes the significant differences
between the statutory tax rate and the Company’s effective
tax for financial statement purposes for the year ended March
31, 2003.
2003 2001
Statutory tax rate 42.0 % 42.0 %
Lower tax rates of overseas subsidiaries (10.3)% (7.4)%
Expenses not deductible for tax purposes 7.9 % 20.0 %
Effect of changes in valuation allowance
for deferred tax assets (71.9)% (13.7)%
Reduction of deferred tax assets
due to the change in tax rates 10.2 % —
Other 57.5 % 35.8 %
Effective tax rate 35.4 % 76.7 %
Information for 2002 was not prepared as the Company incurred
a net loss in the year ended March 31, 2002.
The effective tax rate will be reduced for the years commencing
on April 1, 2004 or later due to the revised local tax law. At
March 31, 2003, the Company and consolidated domestic
subsidiaries applied the reduced effective tax rate of 40.6%
for calculating deferred tax assets and liabilities that are ex-
pected to be recovered or settled in the years commencing on
April 1, 2004 or later. As a result, deferred tax assets, income
taxes-deferred and net unrealized holding gains on securities
increased by ¥9 million ($75 thousand), ¥3 million ($25 thou-
sand) and ¥12 million ($100 thousand) compared with what
would have been reported using the currently effective tax rate
of 42.0%.
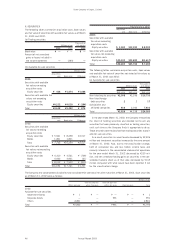
8. SHORT-TERM BANK LOANS AND LONG-TERM DEBT
Short-term bank loans of certain of the Company’s consolidated
subsidiaries consist of notes maturing generally in three months.
The applicable annual interest rates on short-term bank loans
outstanding at March 31, 2003 and 2002 ranged from 1.26%
to 26.42% and from 0.50% to 24.30% , respectively.
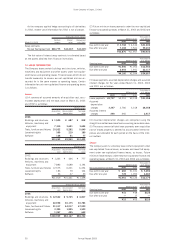
Long-term debt at March 31, 2003 and 2002 were as follows:
Thousands of
Millions of yen U.S. dollars
2003 2002 2003
1.5% unsecured convertible
bonds due in 2005
¥ 11,483 ¥ 11,483 $ 95,692
0.35% unsecured convertible
bonds due in 2002
—19,999 —
0.55% unsecured convertible
bonds due in 2005
20,000 20,000 166,667
1.75% unsecured bonds
due in 2003
5,000 5,000 41,667
2.15% unsecured bonds
due in 2005
10,000 10,000 83,333
1.68% unsecured bonds
due in 2006
20,000 20,000 166,667
1.89% unsecured bonds
due in 2007
10,000 10,000 83,333
1.61% guaranteed notes
due in 2002
—5,432 —
1.50% guaranteed notes
due in 2005
7,206 8,883 60,050
Loans, primarily from banks
with interest principally
at 0.82% to 7.00%
Secured
322 328 2,683
Unsecured
34,184 5,915 284,866
118,195 117,040 984,958
Less current portion
12,727 27,168 106,058
¥105,468 ¥ 89,872 $878,900
Significant components of the Company’s deferred tax assets
and liabilities at March 31, 2003 and 2002 were as follows:
Thousands of
Millions of yen U.S. dollars
2003 2002 2003
Deferred tax assets:
Loss on devaluation
of inventory ¥ 5,365 ¥ 5,465 $ 44,708
Accrued expenses not
deductible for tax
purposes 7,887 5,956 65,725
Accrual for losses on
business restructuring 367 5,597 3,058
Depreciation 8,378 8,028 69,817
Retirement and severance
benefits 2,383 5,101 19,858
Tax loss carry forwards 23,275 21,767 193,958
Other 12,665 13,640 105,543
Total gross deferred
tax assets 60,320 65,554 502,667
Less valuation allowance
(37,026) (44,628) (308,550)
Net deferred tax assets
¥23,294 ¥20,926 $194,117
Deferred tax liabilities:
Unrealized gain from
changes in fair market
values of trading
securities —¥ (944) —
Net unrealized holding
gains on securities (356) (670) (2,967)
Other (1,077) (823) (8,975)
Total gross deferred
tax assets ¥ (1,433) ¥ (2,437) $ (11,942)
Net deferred tax assets ¥21,861 ¥18,489 $182,175